Water and wastewater energy monitoring
Relate energy use to treated volume, hydraulic duty and treatment load without displacing SCADA, process control, permit monitoring or laboratory evidence.
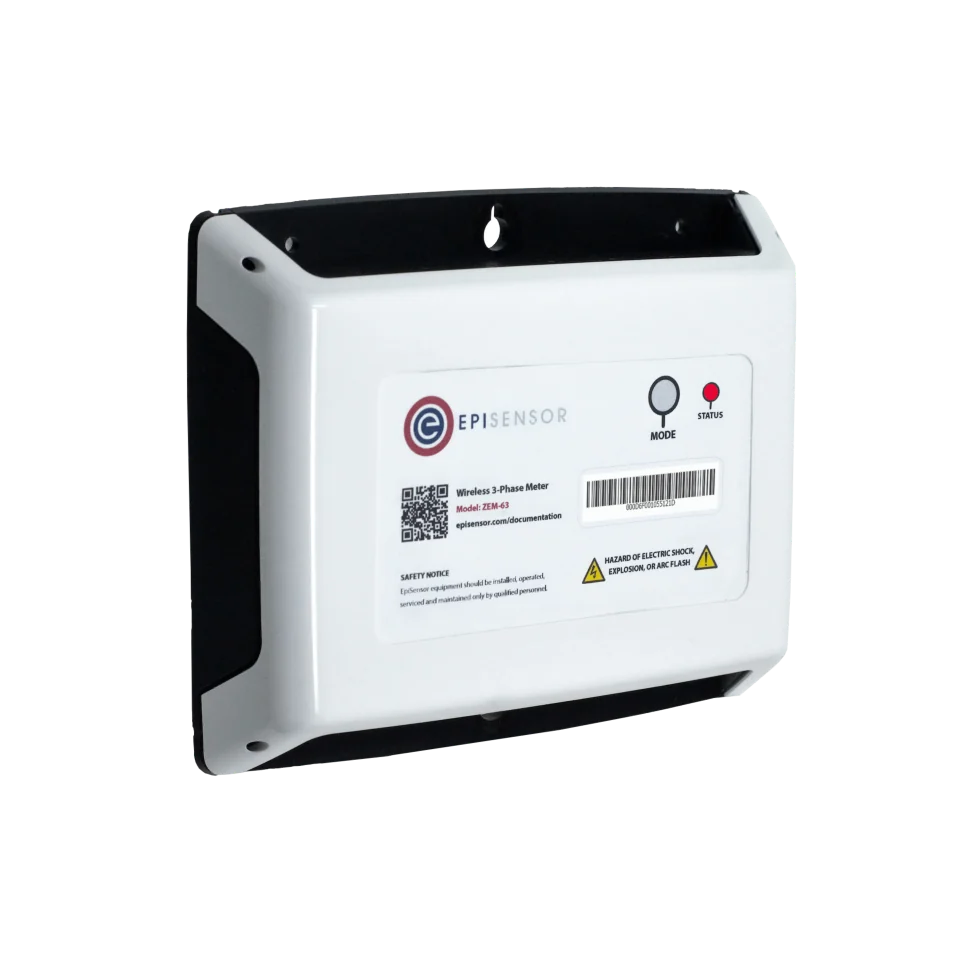
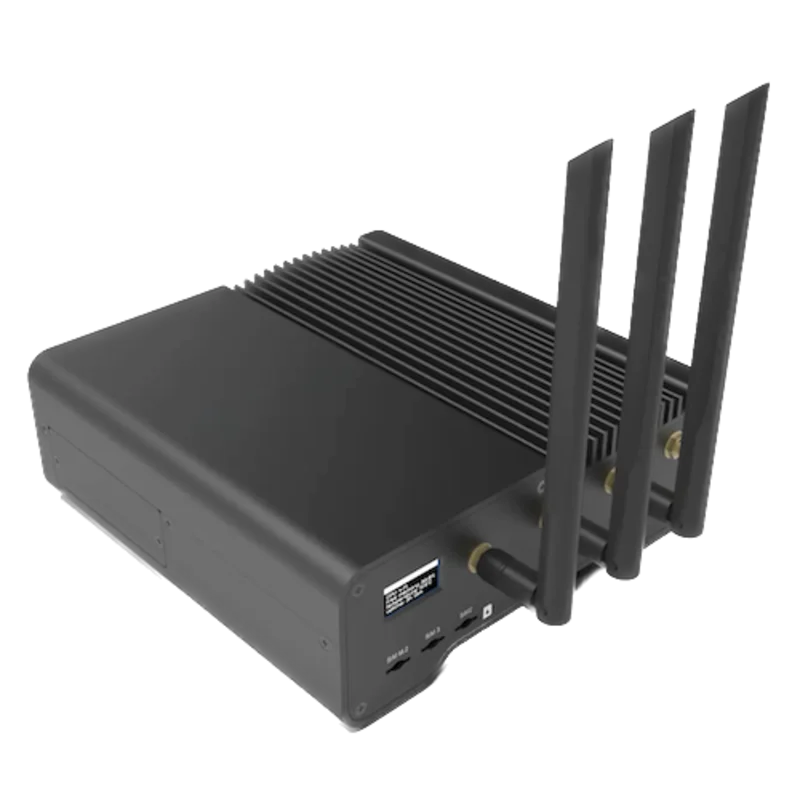
- Measure
- Incoming energy, on-site generation and non-overlapping intake, pumping, treatment, sludge and site-service boundaries
- Good practice
- Keep total energy and energy per treated volume beside flow, head, process load, quality, operating state and complete-period data coverage
- Sensors
- ZEM-65, electrical boundaries; approved meter and process points provide hydraulic and treatment context
- On site
- ZGW-20 Gateway, Edge retains local histories, data-quality states, calculations and operating alarms
Build the energy balance around the treatment process
Draw the physical water and wastewater process first, then assign each electrical load, fuel input and energy output to one boundary only. Separate imported electricity and fuel from solar, biogas and combined heat and power generation. Keep raw-water intake, lift and distribution pumping distinct from treatment; keep sludge treatment and site services distinct from the liquid train. This gives operators a reconciled site total and stage intensities without turning the monitoring layer into SCADA or a process controller.
| Process boundary | Evidence to collect | Acceptance boundary |
|---|---|---|
| Intake, conveyance and lift pumping | Pump and station energy with flow, level, pressure, differential head, run state and valve or drive status from approved sources | Energy is assigned once to the named station or hydraulic stage; SCADA retains command, wet-well, surge and protection authority |
| Liquid treatment train | Energy for aeration, mixing, filtration, backwash and disinfection with treated flow, process load, operating mode and approved quality context | Monitoring explains energy; process setpoints, chemical dose, disinfection dose and compliance decisions remain in approved systems and procedures |
| Sludge, energy recovery and site services | Thickening, digestion, dewatering and handling energy; biogas and CHP inputs and outputs; buildings, odour control, lighting and other site services | Generation is reported separately from consumption, with heat and electrical units kept distinct; gas safety, CHP protection and sludge-quality controls remain authoritative |
Hardware for wastewater treatment energy monitoring
Meter declared electrical boundaries independently, then acquire only the approved process points needed to interpret them. Survey voltage, conductor size, panels, hazardous areas, network ownership, signal isolation, point count and wireless coverage before selecting hardware.
Measures site, pump-station, treatment-stage, sludge-process, CHP-auxiliary or site-service electrical boundaries
1 per declared three-phase electrical boundary 3 or 4 wire
- Choose 120 A split-core CTs or 300 A, 1 kA and 3 kA Rogowski coils only after surveying each declared supply
Class 0.5S to IEC 62053-22 with its calibrated CTs, 0.1 A to 3 kA
Retains local histories, reconciliations, data-quality states, stage indicators and actionable alarms
1 per surveyed works, plant area or remote-station group point count, network path and wireless coverage checked on site
For a dedicated segment or a segment on which its master role and read-only point list are approved
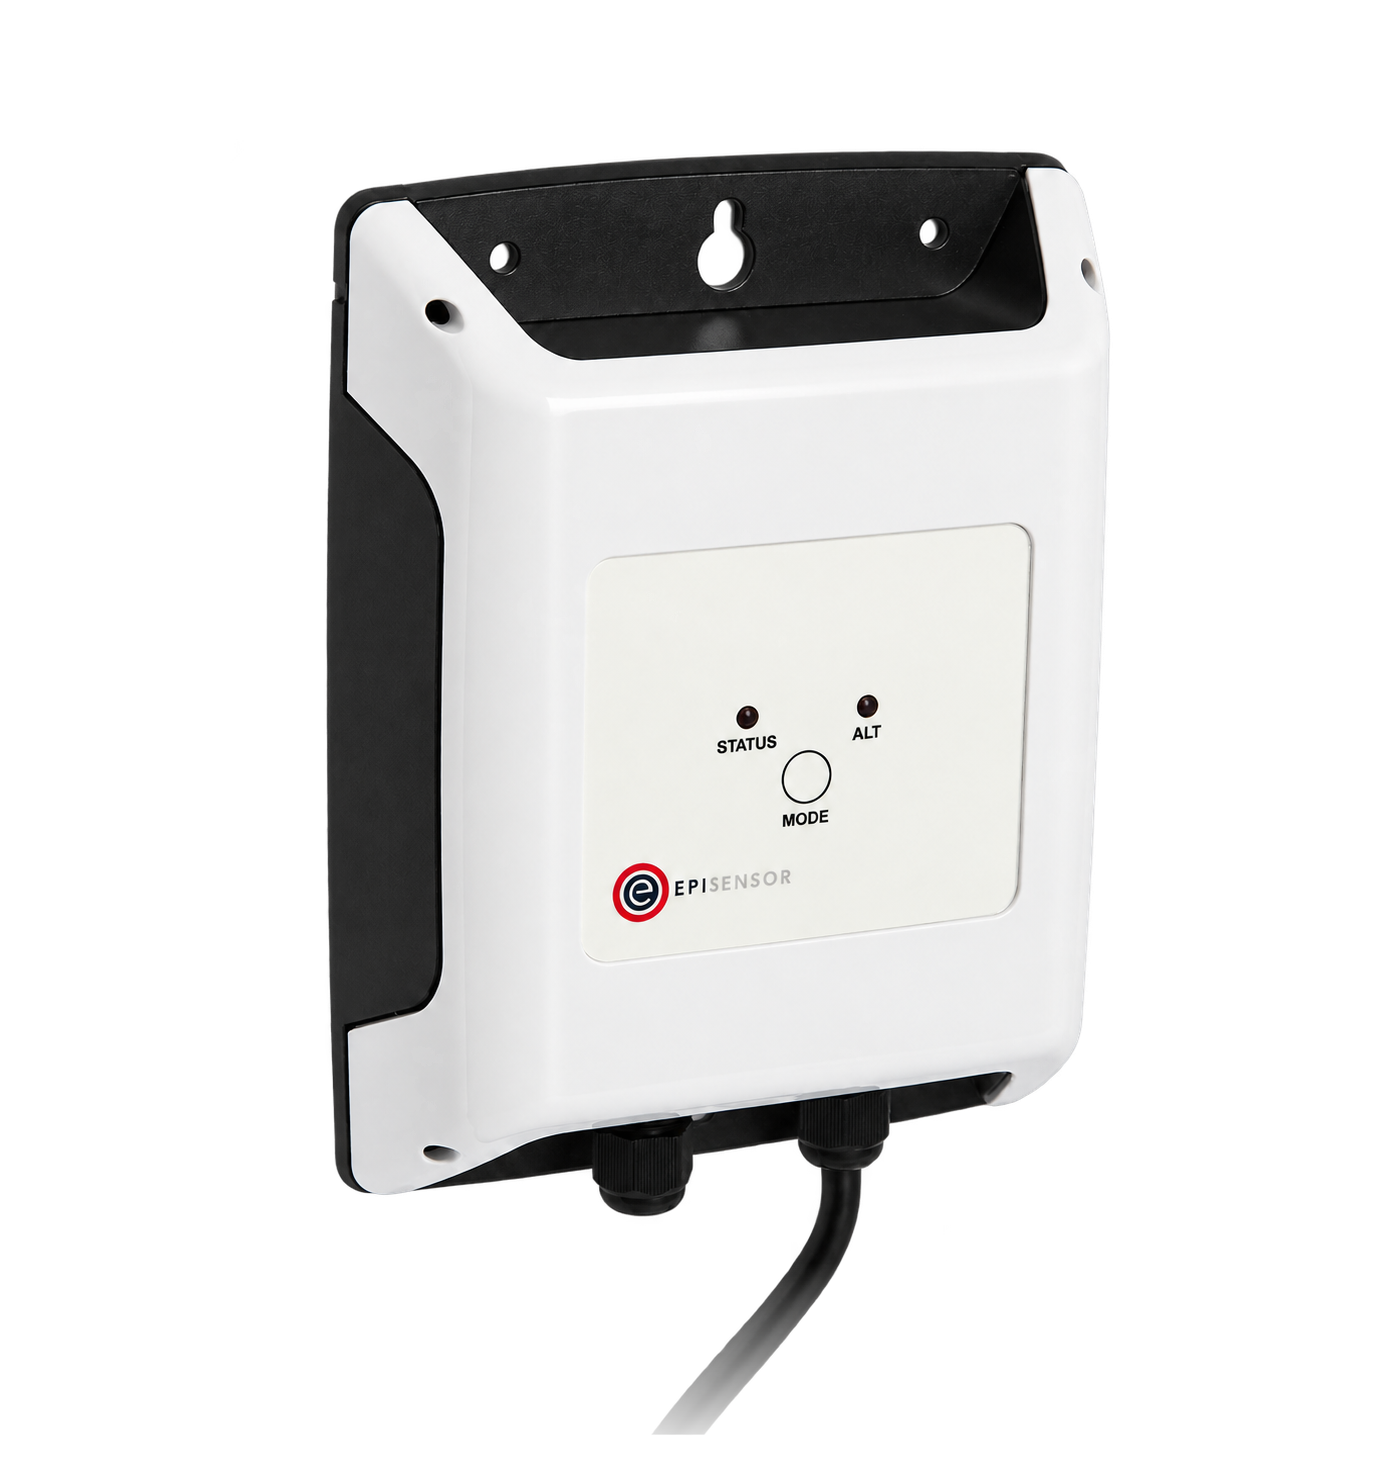
Reads approved energy, flow, pressure, level, load, quality, state or generation registers from a documented Modbus RTU segment
1 per suitable RS-485 segment up to 30 configured registers
Modbus RTU master over RS-485, 300 to 115,200 baud
For approved isolated process signals that are not available through a suitable meter or register interface
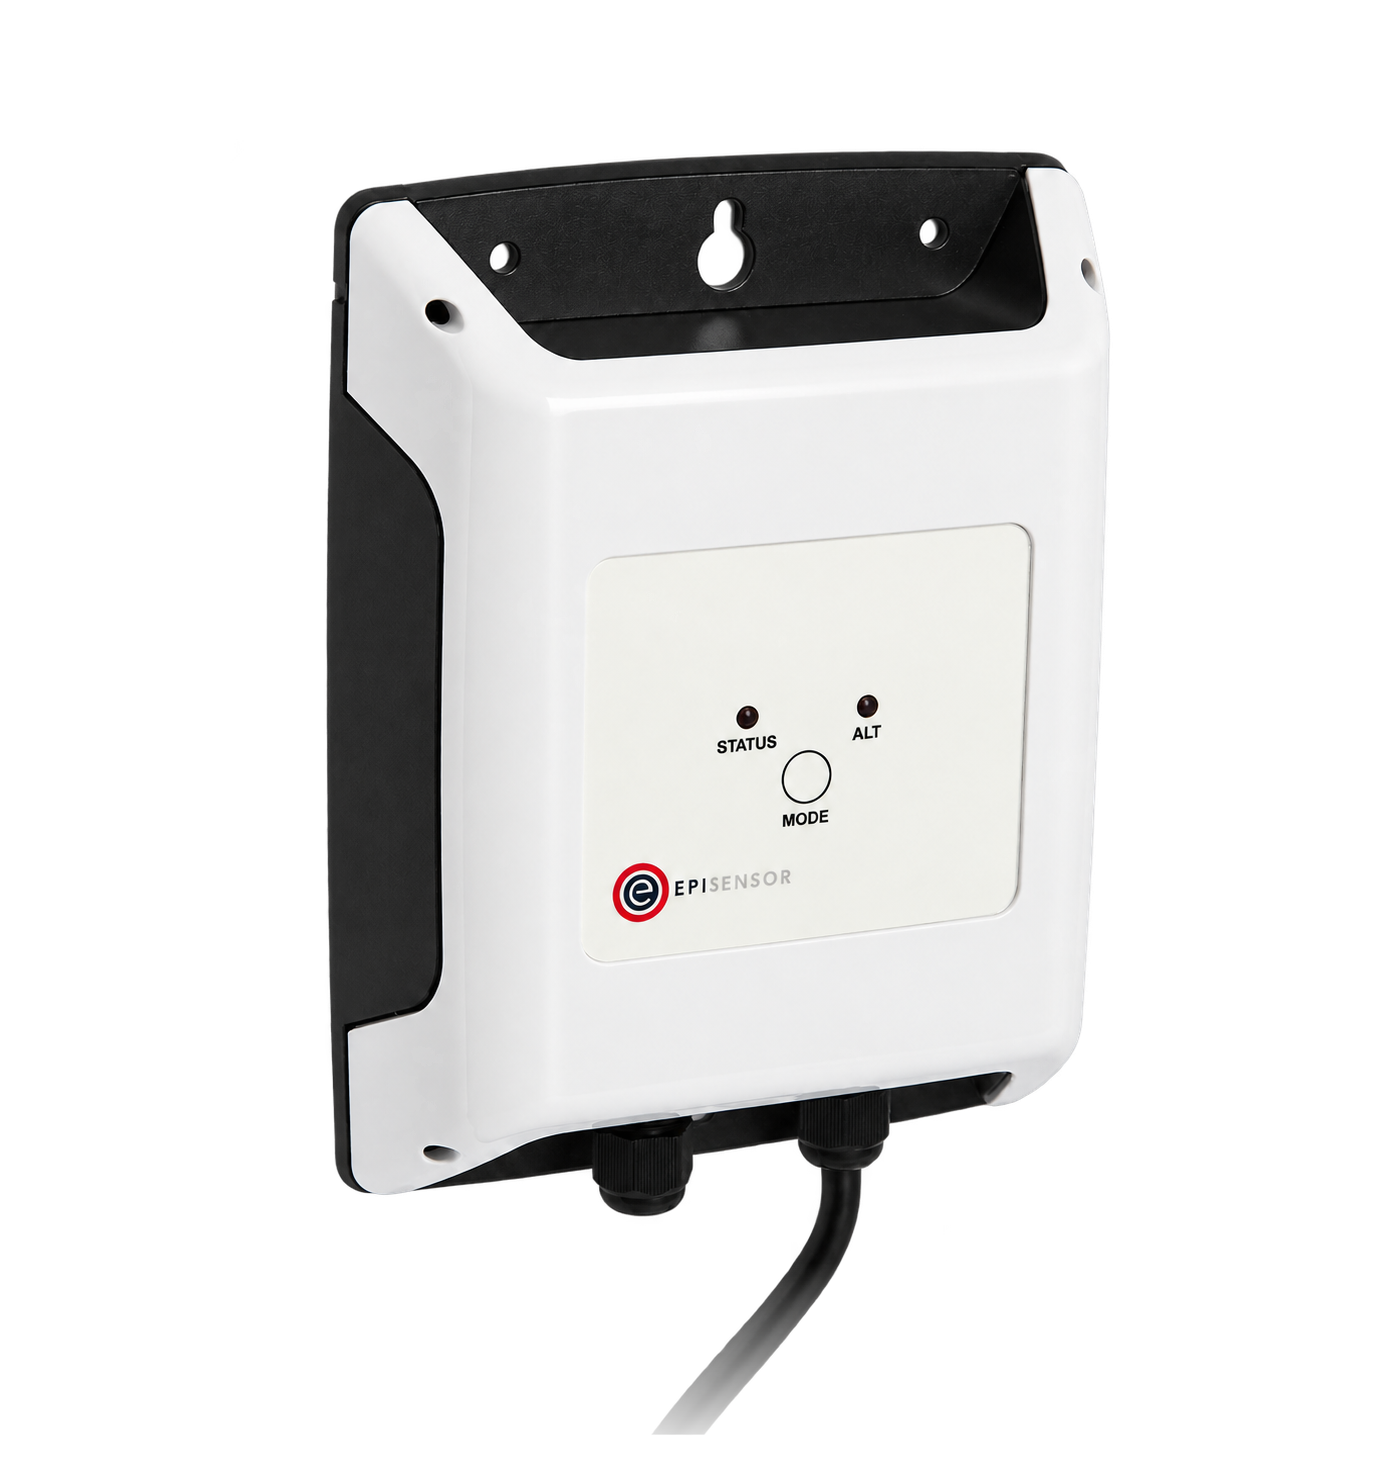
Reads two externally powered 4-20 mA signals where flow, pressure, level or another process variable and its scaling are documented
1 per pair of compatible current loops two 0 to 20 mA inputs
0 to 20 mA at 0.001 mA resolution, up to 36 V DC
Build a stage hierarchy that reconciles
Give every point a site, stage or asset boundary, source identifier, unit, scale, interval, timestamp basis, quality rule and owner. Retain raw cumulative energy, volume and generation before calculating rates, balances or normalised indicators.
How treatment energy and process context reach Edge
Independent energy meters and approved read-only process interfaces keep separate identities. Edge aligns timestamps and quality for analysis without becoming the SCADA, PLC, protection system, laboratory record or permit-monitoring system.
- Link
- Zigbee
- Modbus
- Edge
- Platforms
| Position | What it tells you | Reference | Sensor |
|---|---|---|---|
| Site energy and generation | Imported electricity and fuel, exported electricity, solar, biogas use, CHP electricity and useful heat, with auxiliaries assigned once | Keep consumption, generation, import and export as separate registers before calculating net energy or progress towards energy neutrality EU wastewater directive | ZEM-65 (on this page) |
| Intake, lift and distribution pumping | Energy, cumulative volume, flow, level, pressure, differential head, speed, run state and available pump configuration | Compare like hydraulic duties; volume alone does not explain changes in source depth, static head, friction, storage operation or pump availability EPA energy guide | ZMB-31 (on this page) |
| Treatment and disinfection stages | Aeration, mixing, filtration, backwash and disinfection energy with flow, process load, operating mode and approved water-quality context | Use energy data to investigate performance while preserving approved process limits, chemical dose, disinfection dose and compliance evidence EPA energy guide | ZMB-31 (on this page) |
| Sludge treatment and dewatering | Thickening, digestion, heating, mixing, dewatering and handling energy with feed volume, solids load, cake output and approved process state | Report sludge energy separately from the liquid train and keep biogas production, use, flare and CHP conversion as distinct quantities JRC and IEA Bioenergy | ZIO-22 (on this page) |
| Clocks, quality and interface health | Source time, Gateway receipt time, last valid sample, gaps, stale states, counter resets, manual overrides and interface availability | Exclude or label incomplete periods; never replace missing energy, volume, load or quality values with zero EPA assessment guide | ZGW-20 (on this page) |
Keep stage and site totals together. Energy per cubic metre can improve while total site energy rises because flow, lift, influent strength, treatment standard or weather changed. Show both and state the comparison boundary.
Use the relevant treatment context. Flow is the common denominator, but wastewater energy can also vary with organic and nutrient load, required effluent quality, recirculation and sludge handling. Use only approved, quality-marked context.
Preserve the official record. Permit flow, laboratory results, online analysers and operator records retain their approved status. A copied value in an energy system is context, not replacement compliance evidence.
Water treatment energy management workflow
Build a stable read-only record before calculating benchmarks or alarms. Operators, process engineers, energy staff and environmental teams agree valid states, exclusions and response ownership.
- Reconcile site and stage energy
- Compare the site import with non-overlapping pumping, treatment, sludge, generation-auxiliary and service boundaries over the same complete period. Quantify unmetered residuals rather than assigning them to a process.
- Normalise with hydraulic and treatment context
- Report energy per treated cubic metre beside total energy and flow. Where load, head, pressure, source quality, effluent requirement, weather or operating mode materially changes demand, retain it with the baseline and comparison.
- Detect persistent operating exceptions
- Compare actual and expected energy only inside an agreed operating state. Route persistent deviation, abnormal idle load, changed pump duty, loss of context or failed measurement to a named investigation without changing process setpoints.
- Keep process and safety authority in place
- Default acquisition to read only. SCADA, PLCs, protection, safety systems, environmental permits, laboratory procedures, chemical dosing and operator controls remain authoritative. Any write requires a separate process, safety, cybersecurity and permit review with witnessed testing.
Commissioning checks
Commission boundaries, point meaning, clocks, balances and operating context before judging efficiency or savings.
-
Approve the stage map and authority boundary
Mark intake, pumping, treatment, disinfection, sludge, generation and site-service boundaries on process and electrical drawings. Record SCADA, PLC, safety, protection, permit and laboratory ownership.
Pass when every energy load and output has one boundary, and monitoring has no undeclared command, dosing, protection or compliance role.
-
Validate every point at its source
Compare identifiers, units, scale, sign, counter behaviour, state text and quality with the meter, SCADA display, register map or instrument during known stopped, running and fault conditions.
Pass when the point register and live source agree, including invalid, stale, manual, reset, rollover and out-of-range states.
-
Prove clocks and interval assignment
Compare source, Gateway and reporting timestamps across an interval boundary and seasonal clock change, then interrupt and restore one approved test feed.
Pass when timezone and aggregation rules are reproducible, the gap remains missing, and a stale value cannot appear current or zero.
-
Reconcile site, stages and generation
Compare imported energy with non-overlapping stage loads, services, on-site generation, export and auxiliaries over one complete period using raw cumulative registers.
Pass when the residual is within the agreed meter uncertainty and scope, or is quantified and assigned for investigation.
-
Challenge the normalised baseline
Replay a baseline and later period with treated volume, hydraulic duty, process load, quality requirement, operating state and data coverage. Review exclusions and changed conditions.
Pass when another engineer can reproduce totals and intensities, and changed treatment conditions are not reported as unexplained savings.
-
Witness read-only behaviour and recovery
Verify interface permissions, disable and restore each approved acquisition path, and observe SCADA, PLC, alarms, dosing, protection and operator controls throughout.
Pass when monitoring loss is visible, recovery is orderly, no command is issued, and treatment and compliance systems remain unaffected.
Limits of water and wastewater energy monitoring
The monitoring record supports energy management and operational investigation. It does not control treatment or establish water quality, environmental compliance, safety or verified savings by itself.
- Energy per treated volume is incomplete when hydraulic duty, influent or source quality, treatment load, required output quality, operating mode or sludge handling has materially changed.
- A protocol connection does not establish correct meaning, units, scaling, timestamp quality or permission to write. Commission the exact device, register and point contract.
- Copied permit-flow, analyser or laboratory values do not replace certified instruments, sampling, chain of custody, laboratory methods, operator records or regulatory reporting.
- Energy monitoring does not set aeration, mixing, filtration, backwash, disinfection or chemical-dosing requirements and does not override process limits or water-quality protections.
- Biogas and CHP monitoring does not replace gas detection, hazardous-area design, engine protection, grid protection, emissions controls or safe operating procedures.
- Savings and energy-neutrality claims require defined boundaries, complete data, declared conversion factors and treatment of relevant variables; a lower net import alone is insufficient.
Sources
- Energy Efficiency in Water and Wastewater Facilities (opens in a new tab) (opens in a new tab) U.S. Environmental Protection Agency
- Energy Use Assessment at Water and Wastewater Systems (opens in a new tab) (opens in a new tab) U.S. Environmental Protection Agency
- Directive (EU) 2024/3019 concerning urban wastewater treatment (opens in a new tab) (opens in a new tab) European Parliament and Council
- Minimum requirements for self-monitoring of flow: MCERTS performance standard (opens in a new tab) (opens in a new tab) Environment Agency
- Sustainable biogas production in municipal wastewater treatment plants (opens in a new tab) (opens in a new tab) European Commission Joint Research Centre and IEA Bioenergy
- Wireless 3-Phase Electricity Monitor datasheet (opens in a new tab) EpiSensor. Specifications, ranges and ordering codes.
Related
- OverviewEnergy monitoring
- CalculatorLoad factor calculator
- GuideISO 50001 energy management and the data it needs
- GuideMeasuring energy savings against a baseline


Third-party devices for this application
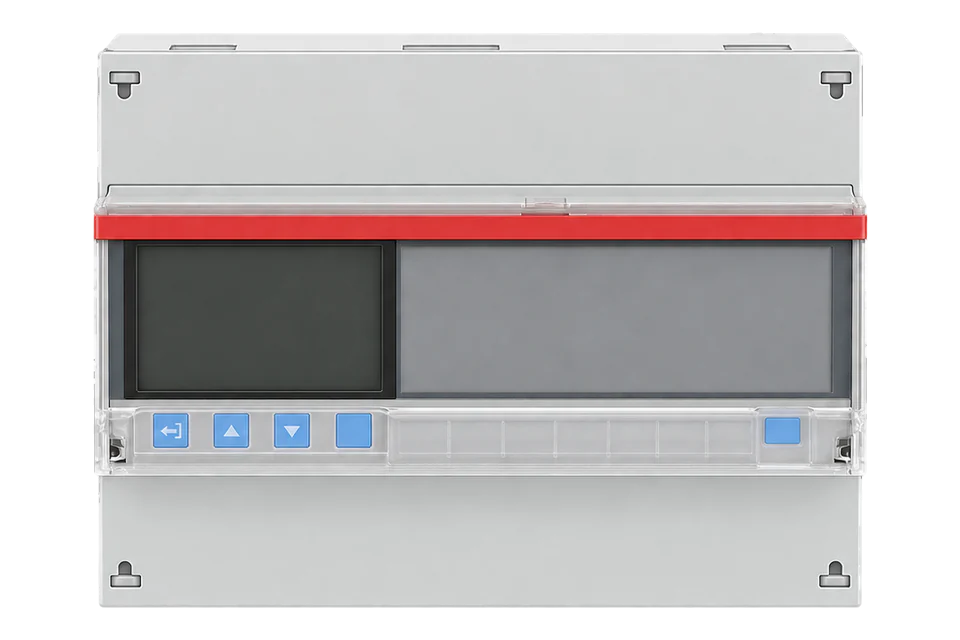
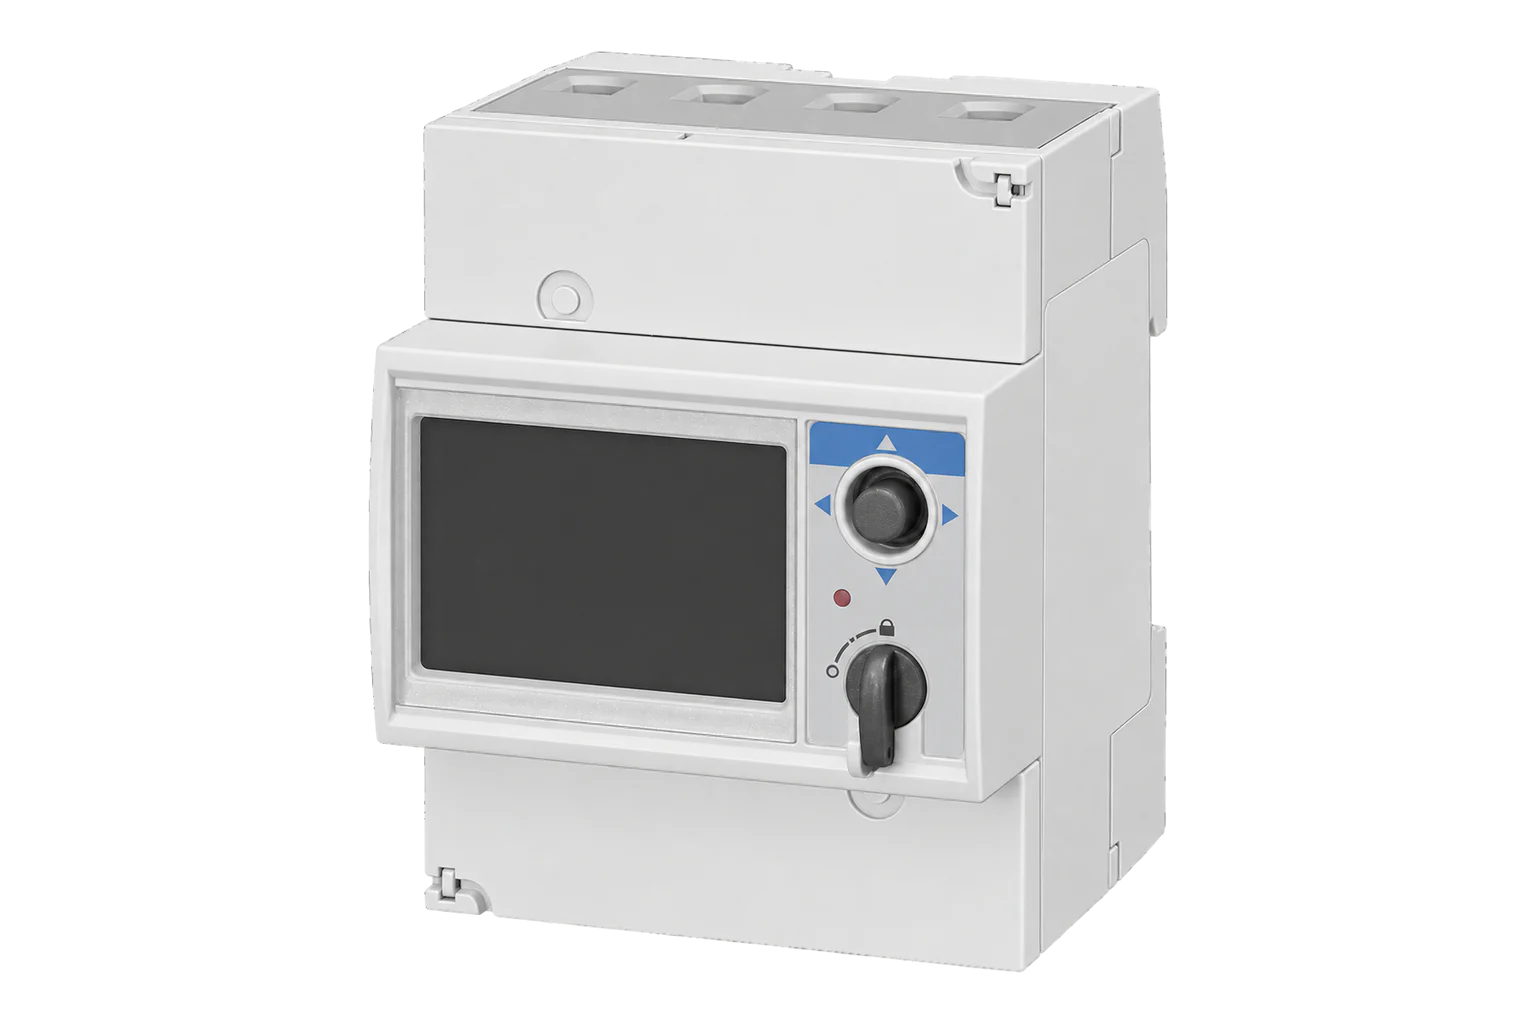
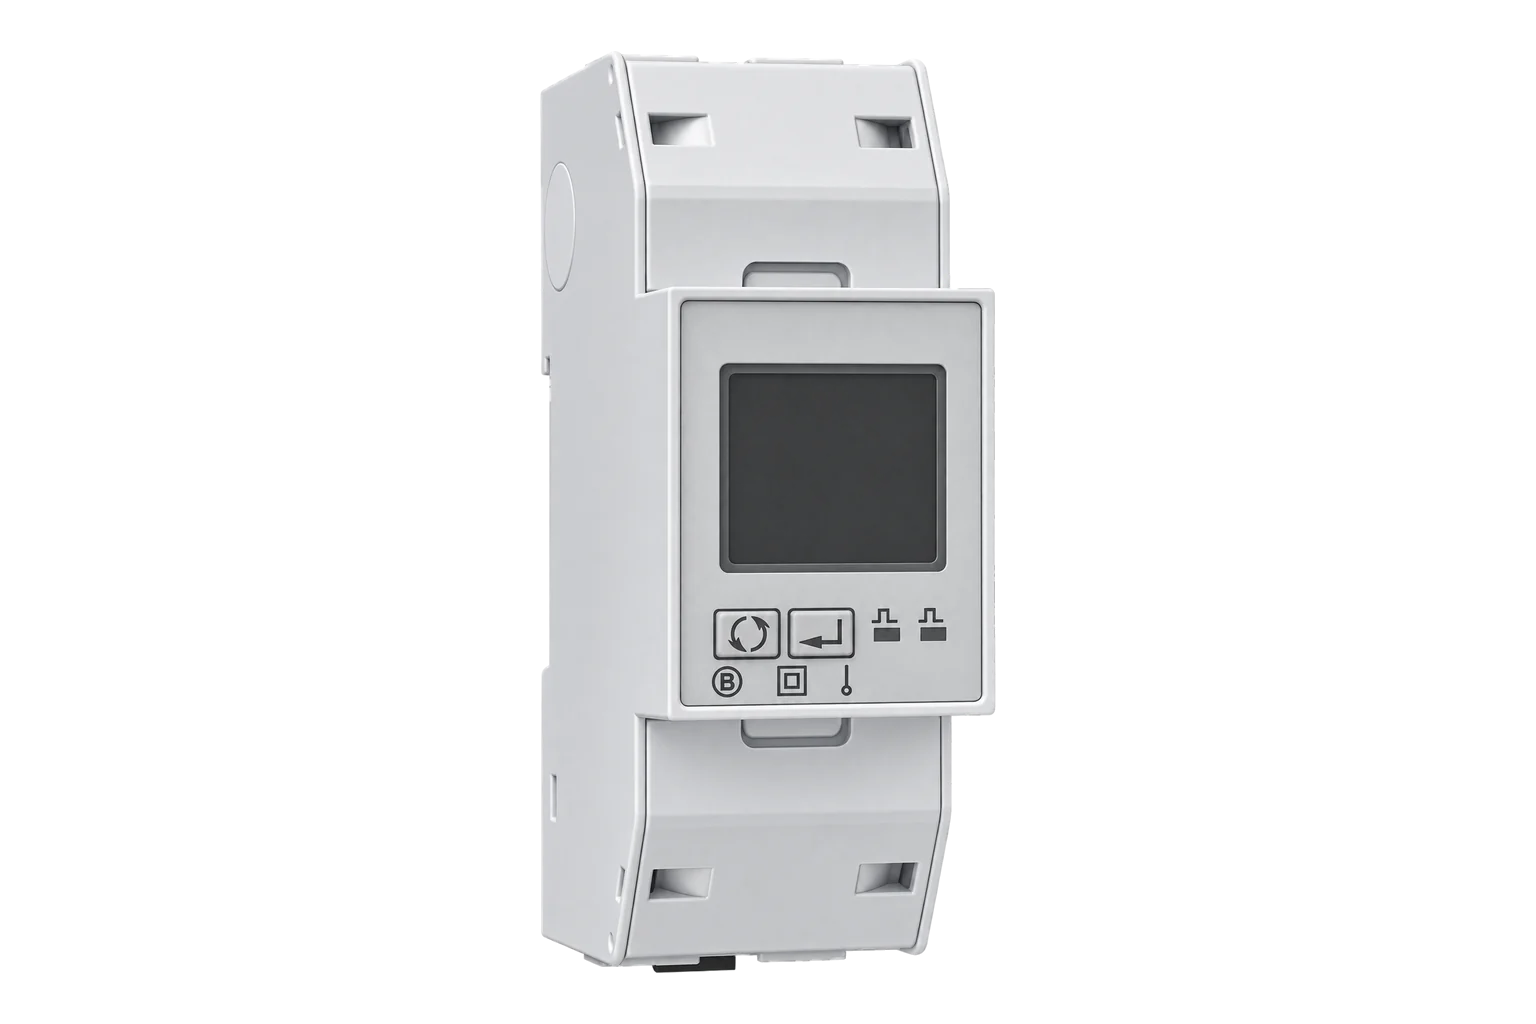
More in the Device Directory: Energy meters (62), Current transformers (7)
Map one works before selecting points
Share the process flow, single-line diagrams, meter schedule, SCADA point list, treatment and permit boundaries, energy sources, generation, representative operating periods and the decisions the data must support. An engineer can define a read-only pilot, interval plan and commissioning evidence.