Industrial energy monitoring
Measure significant energy uses alongside production context so engineers can separate operating changes, waste and genuine performance improvement.
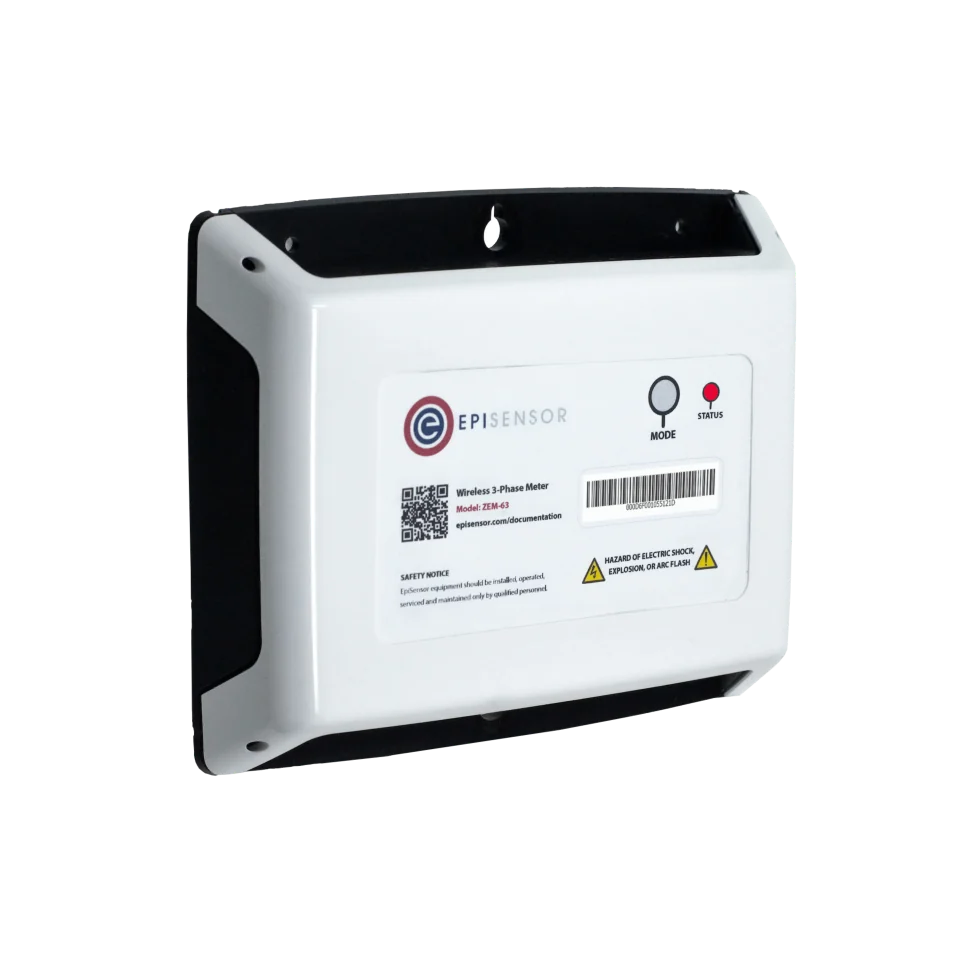
- Measure
- Site supplies, process lines, large utilities and the operating variables that explain their energy use
- Good practice
- A non-overlapping energy balance, declared intervals and an evidence trail from source meter to performance indicator
- Sensors
- ZEM-65, electrical boundaries; documented meter, PLC and instrument points provide process context
- On site
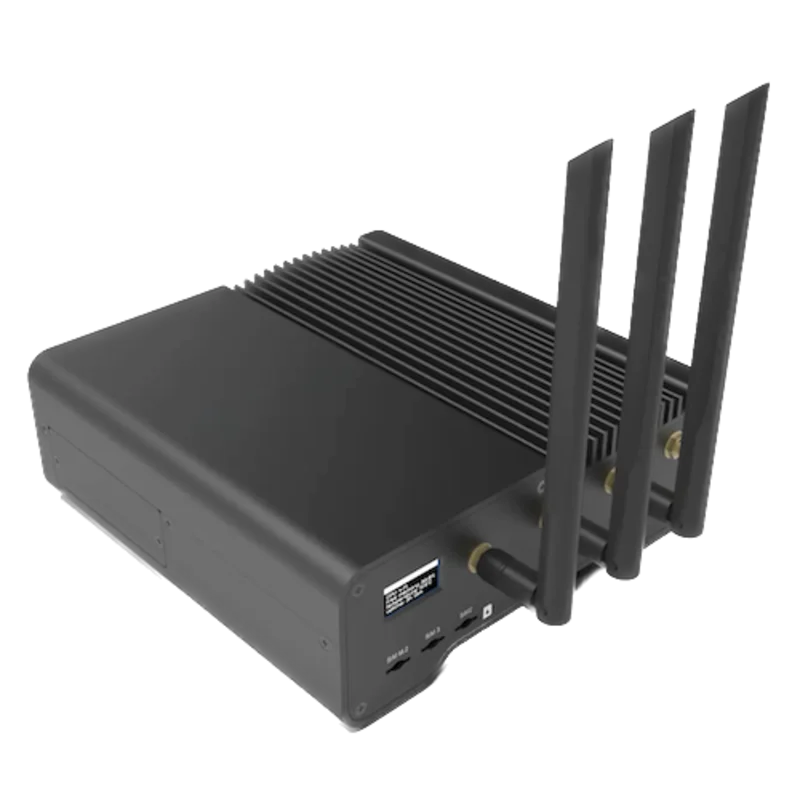
- ZGW-20 Gateway, Edge retains local histories, data quality and alarms
Manufacturing energy monitoring starts with significant energy uses
List every incoming energy source, build a first energy balance and select significant energy uses using documented criteria for consumption and improvement potential. For each selected process, state the decision the data must support: restoring an operating standard, finding out-of-hours load, comparing products or shifts, verifying an action plan, or investigating a fault. This prevents a large point list from becoming a monitoring system with no operational owner.
| Scope decision | Evidence to collect | Acceptance boundary |
|---|---|---|
| Energy balance | All purchased and generated energy, with non-overlapping site, line and utility boundaries | Child totals reconcile to their parent for the same complete period, with known unmetered use stated |
| Significant energy use | Consumption, improvement potential, operating states and relevant variables such as output, recipe, weather or hours | The organisation documents its significance criteria and reviews the selected uses when operations change |
| Performance improvement | An energy baseline, energy performance indicator, action date, data coverage and adjustment method | A lower trend is not called a saving until relevant variables and changed conditions have been considered |
Hardware for industrial energy monitoring
Meter declared energy boundaries independently, then read only the documented process points needed to explain them. Survey conductor size, voltage, network roles, panel access, point count and wireless coverage before selecting hardware.
Measures site, line, machine or utility-system electrical boundaries
1 per declared three-phase electrical boundary 3 or 4 wire
- Choose 120 A split-core CTs or 300 A, 1 kA and 3 kA Rogowski coils only after surveying each declared supply
Class 0.5S to IEC 62053-22 with its calibrated CTs, 0.1 A to 3 kA
Retains local histories, calculations, data-quality states and actionable alarms
1 per surveyed site or production area point count, network path and wireless coverage checked on site
For a dedicated segment or a segment on which its master role is approved
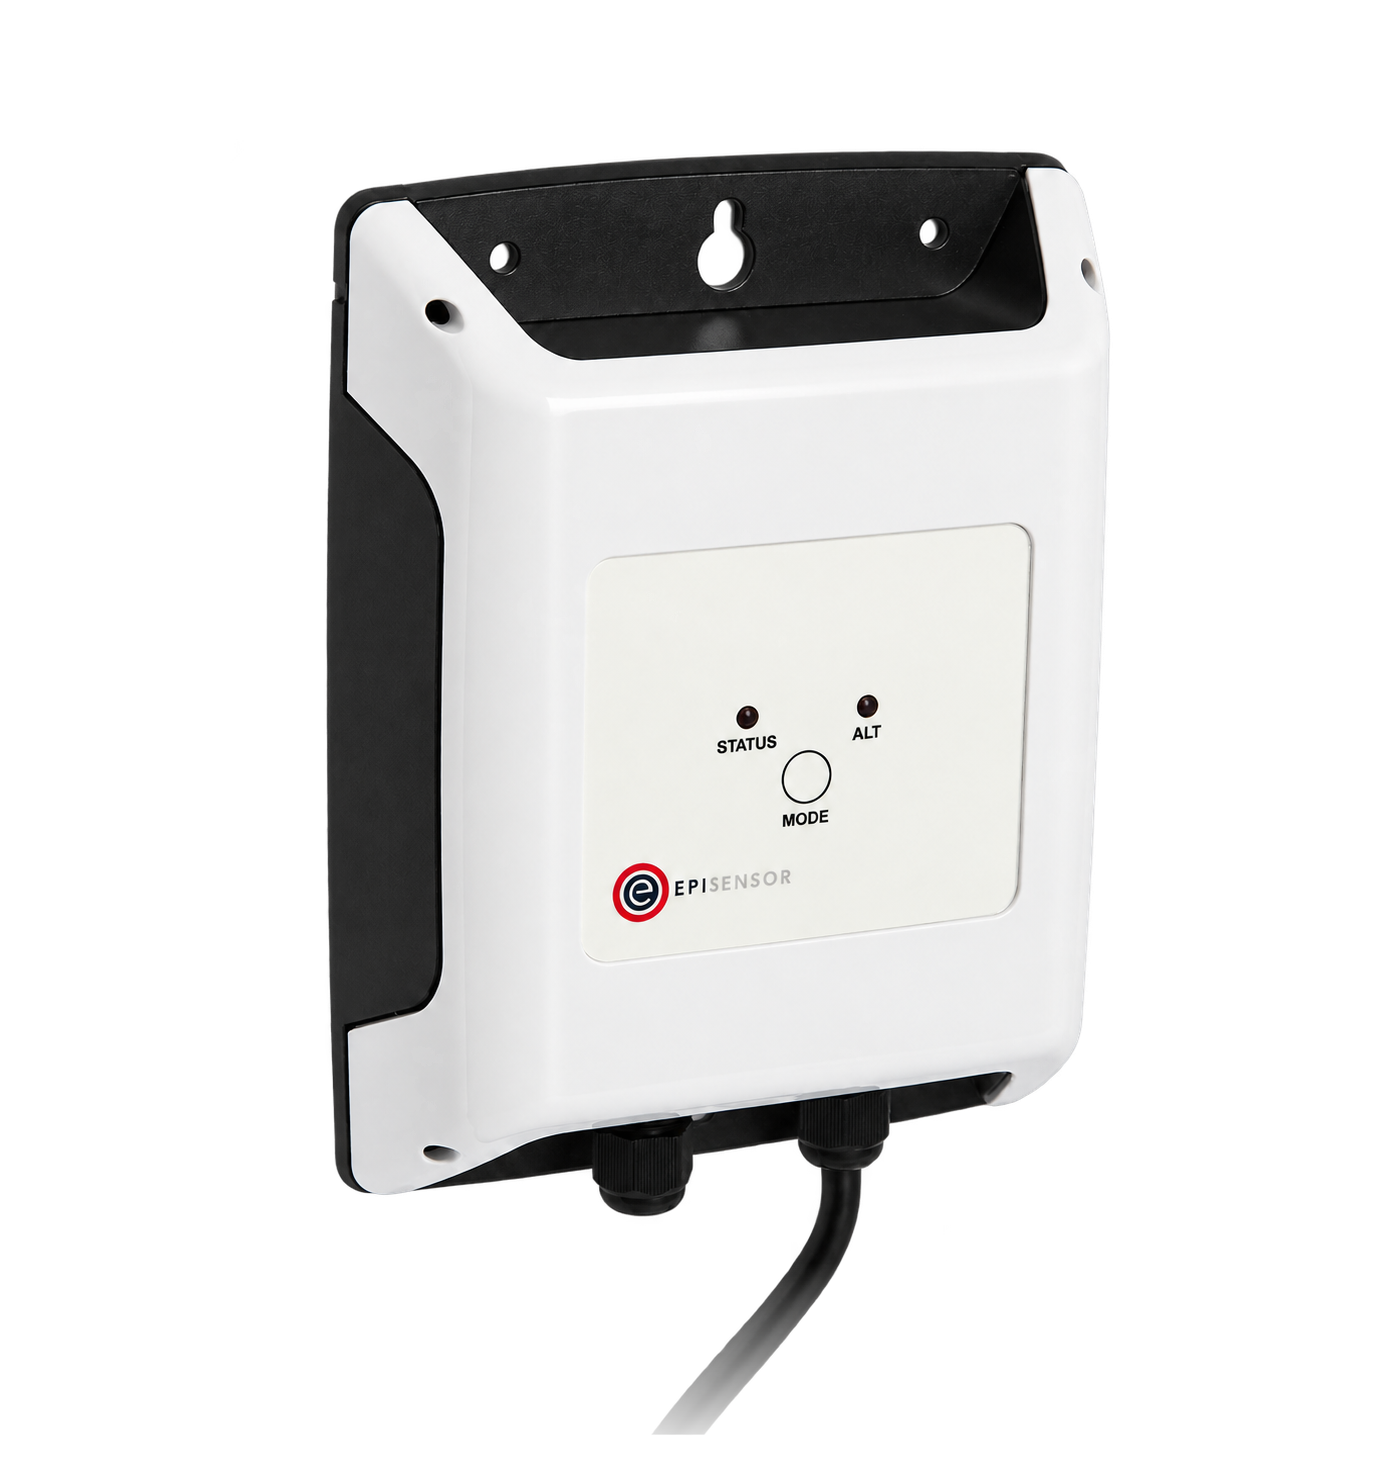
Reads approved energy, state and production-context registers from a documented Modbus RTU segment
1 per suitable RS-485 segment up to 30 configured registers
Modbus RTU master over RS-485, 300 to 115,200 baud
For flow, pressure or other variables needed by the performance model
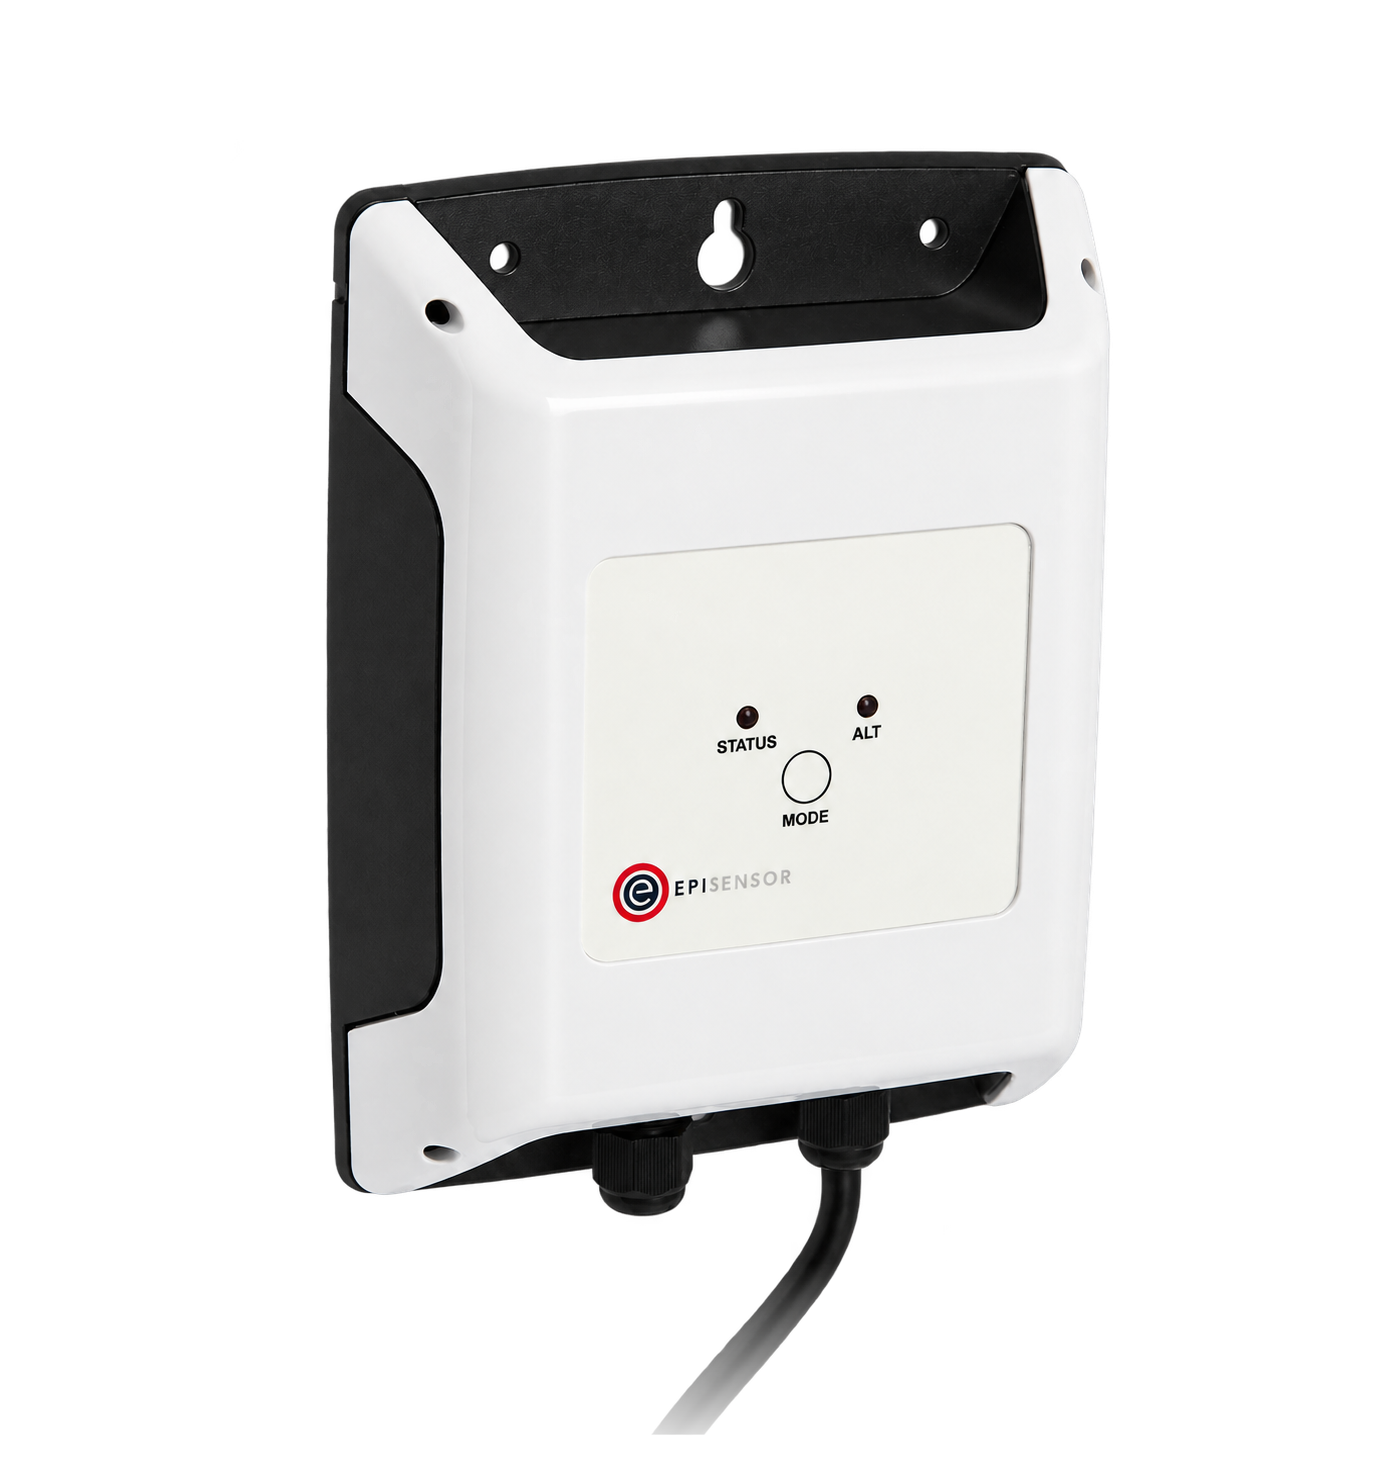
Reads two externally powered 4-20 mA process signals where the raw loop and engineering scaling are documented
1 per pair of compatible current loops two 0 to 20 mA inputs
0 to 20 mA at 0.001 mA resolution, up to 36 V DC
Build the point list around the energy balance
Every point needs a boundary or asset, source identifier, unit, scale, valid range, interval, timestamp basis, quality rule and owner. Retain cumulative energy and raw production counters before calculating rates or normalised indicators.
How manufacturing energy and context reach Edge
Independent energy meters and documented process interfaces keep separate identities. Edge aligns them for analysis without becoming the PLC, safety system or settlement meter.
- Wired
- Zigbee
- Edge
- Platforms
| Position | What it tells you | Reference | Sensor |
|---|---|---|---|
| Site and significant-energy-use boundaries | Demand and cumulative electricity, gas, heat, steam or other energy by non-overlapping boundary | Reconcile child boundaries to the parent for the same complete period and state residual unmetered use DOE SEU guide | ZEM-65 (on this page) |
| Production and operating state | Acceptable units, rejects, mass or volume, recipe, shift, run, idle, cleaning, warm-up and shutdown state | Use the variable that physically explains energy use; do not normalise by total output when product mix or quality changes the relationship DOE measurement guide | ZMB-31 (on this page) |
| Industrial utilities and process variables | Compressed-air flow and pressure, steam or heat flow, temperatures, cooling load and other variables required by the chosen model | Record the sensor range, location, accuracy or calibration status and the engineering conversion beside the point ISO 50012 | ZIO-22 (on this page) |
| Data and communications health | Last valid sample, stale state, gaps, counter resets, range failures, interface availability and manual overrides | Exclude or label incomplete periods rather than replacing missing production or energy values with zero DOE measurement guide | ZGW-20 (on this page) |
Preserve raw counters. Keep source cumulative energy and production counts with their timestamps. Derived interval values can then be rebuilt after a clock correction, counter reset or revised reporting rule.
Declare the interval. A 15-minute energy interval, a one-minute machine state and a shift production total have different boundaries. Document how each value is assigned, aggregated and excluded.
Version the context. Record changes to products, recipes, shifts, maintenance, setpoints and metering. A baseline cannot explain a process definition that changed without a trace.
Industrial energy performance workflow
Build a stable read-only record before adding indicators or alarms. Use operators and process engineers to define valid operating states, then make each exception lead to a named check.
- Define the baseline and relevant variables
- Choose a representative period with known data coverage. Record the variables that materially affect the significant energy use, the model form, exclusions and the conditions that require the baseline to be reviewed.
- Keep totals and normalised indicators together
- Report cumulative energy and demand beside energy per acceptable unit, operating hour or another justified EnPI. A better ratio can otherwise hide higher total consumption or lower production.
- Detect operational exceptions
- Compare actual and expected consumption only within a valid operating state. Alarm on persistent deviation, out-of-hours load, abnormal idle demand, loss of context or a failed meter, with a named recipient and response.
- Keep control authority in the approved system
- Default acquisition to read only. PLC programs, machine interlocks, safety instrumented functions, emergency stops and equipment protection remain authoritative. Any write requires a separate design, hazard review, permissions, safe state, rollback and witnessed test.
Commissioning checks
Commission identities, energy balance, clocks and operating context before judging performance or savings.
-
Approve boundaries and system authority
Mark incoming energy, site, line, machine and utility boundaries on the electrical and process drawings. Record meter ownership, network role and every excluded control or safety system.
Pass when energy, production, controls, IT and safety owners agree the map, and monitoring has no undeclared write path.
-
Validate every point at source
Compare identifiers, units, scale, sign, state text and quality against the meter, PLC display, register map or instrument during known stopped, running and fault conditions.
Pass when the point register and live source agree, including counter rollover, invalid, stale, stopped and out-of-range states.
-
Prove clocks and interval assignment
Compare source, Gateway and reporting timestamps across an interval boundary and a daylight-saving change, then interrupt one approved test feed and restore it.
Pass when timezone and interval rules are reproducible, the gap is marked missing, and stale values cannot appear current or zero.
-
Reconcile the energy balance
Compare each parent meter with its non-overlapping children over a complete production period, using cumulative readings before derived interval values.
Pass when the residual is within the agreed metering uncertainty and scope, or is quantified and logged for investigation.
-
Challenge the baseline and EnPI
Replay a complete baseline period and one later period with known output, product mix, operating hours and other relevant variables. Inspect exclusions and model residuals.
Pass when another engineer can reproduce actual, expected and normalised values, and changed conditions do not get reported as unexplained savings.
Limits of industrial energy monitoring
A monitoring record supports energy review and operations. It does not by itself prove savings, product quality, legal compliance, billing accuracy or safe control.
- Significant energy uses and EnPIs are organisation-specific decisions. A generic dashboard cannot choose the boundary, relevant variables or performance model.
- A protocol connection does not establish correct meaning, units, scaling, timestamp quality or permission to write. Commission the exact device and point contract.
- Owner submeters do not replace utility, fiscal or revenue-settlement meters. Keep billing and regulated metrology under the applicable meter, contract and verification process.
- Energy monitoring does not replace PLCs, machine safeguards, safety instrumented systems, emergency stops, protection relays or approved operating procedures.
- Savings require a defined baseline, adequate data coverage and adjustment for relevant variables and changed conditions. A lower measured total or intensity alone is not verification.
Sources
- ISO 50001:2018 Energy management systems (opens in a new tab) (opens in a new tab) International Organization for Standardization
- ISO 50012 Energy data collection plan (opens in a new tab) (opens in a new tab) International Organization for Standardization
- Directive (EU) 2023/1791 on energy efficiency (opens in a new tab) (opens in a new tab) European Parliament and Council
- Determine significant energy uses (opens in a new tab) (opens in a new tab) US Department of Energy Advanced Manufacturing Office
- Measure, monitor and analyse performance metrics (opens in a new tab) (opens in a new tab) US Department of Energy Advanced Manufacturing Office
- Wireless 3-Phase Electricity Monitor datasheet (opens in a new tab) EpiSensor. Specifications, ranges and ordering codes.
Related
-

Compressed air energy monitoring
Measure compressor electricity alongside delivered air and header pressure, then compare complete operating periods before deciding what to investigate. -

Transformer and distribution board monitoring
A meter at the incomer, meters on the feeders worth explaining, and a temperature probe where loading has to be read against heat. -
4-20 mA remote monitoring for process instruments
Current-loop and voltage instruments read by a mains-powered analogue signal sensor, with the range, the scaling and the fault current recorded beside the value.
- OverviewEnergy monitoring
- CalculatorLoad factor calculator
- GuideISO 50001 energy management and the data it needs
- GuideIntelligent energy management systems (IEMS)
Third-party devices for this application
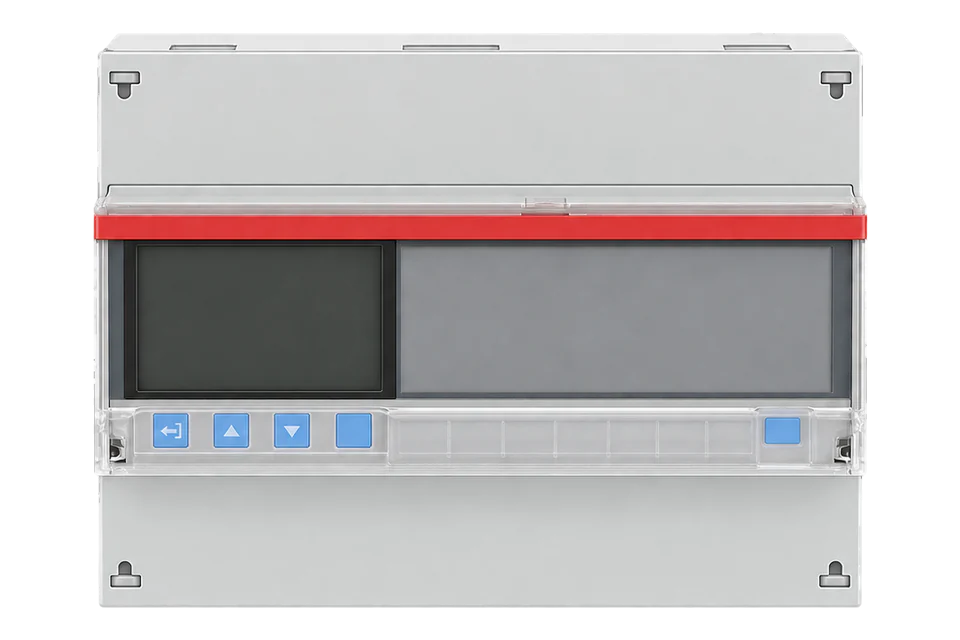
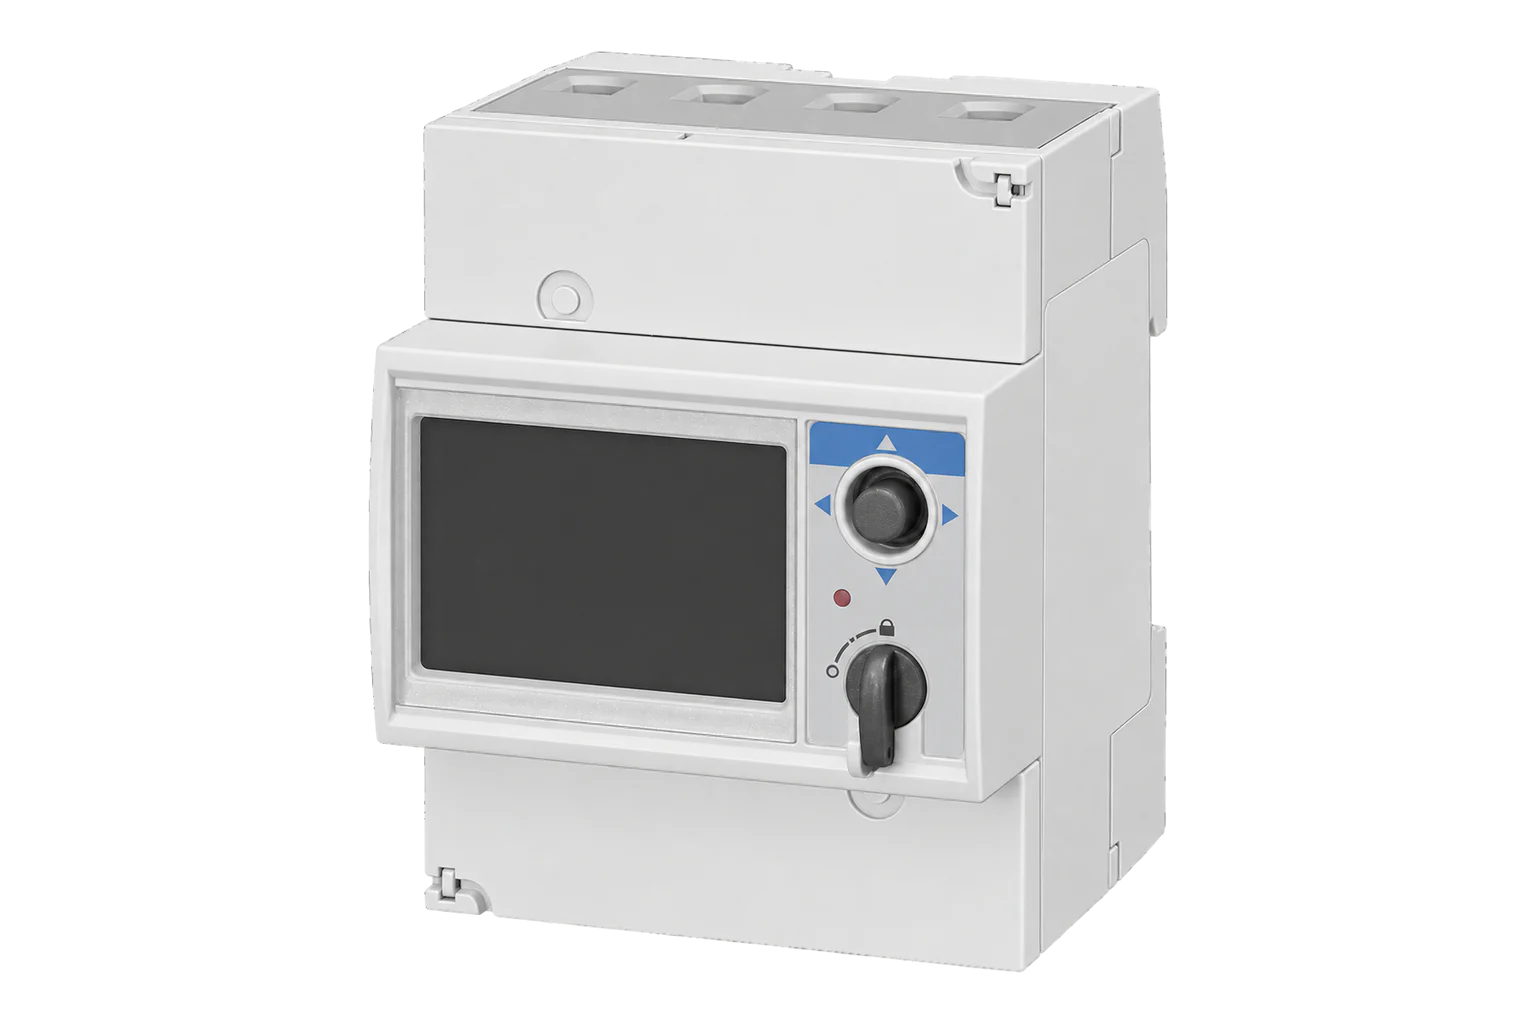
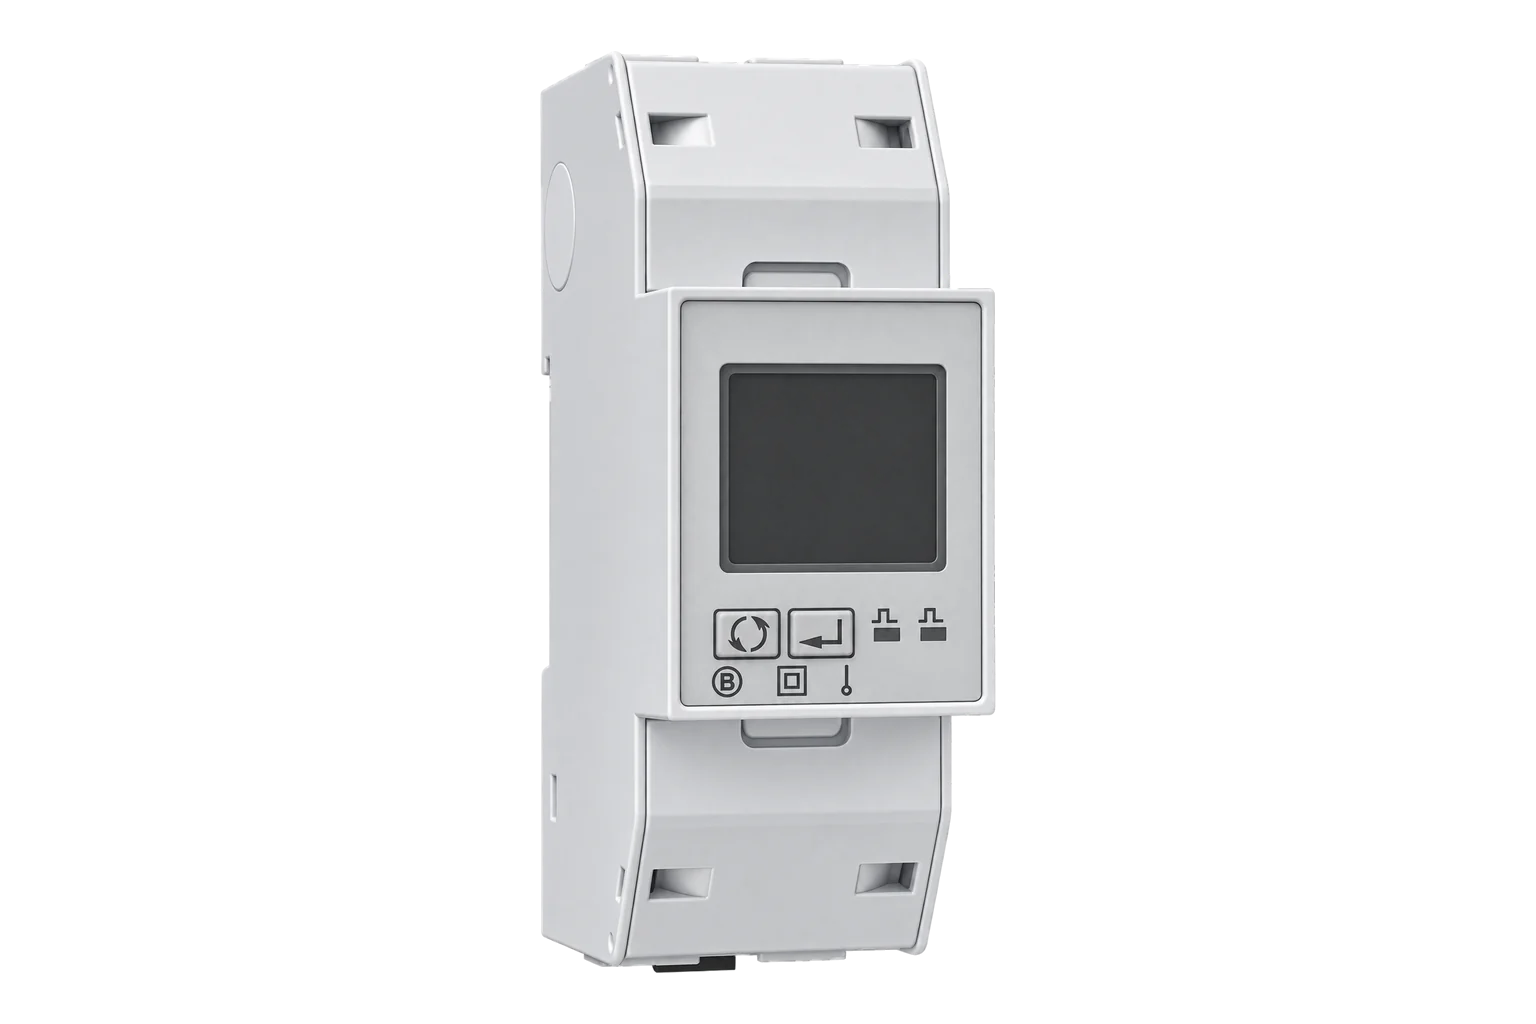
More in the Device Directory: Energy meters (62), Current transformers (7)
Map one significant energy use before choosing points
Send the energy balance, single-line diagrams, process flow, meter schedule, equipment list, production variables and the decision the data must support. An engineer can define a read-only pilot, interval plan and commissioning evidence.