Pump performance monitoring
Motor electrical input, delivered flow and the pressure either side of the pump, so a drop in power can be explained rather than guessed at.
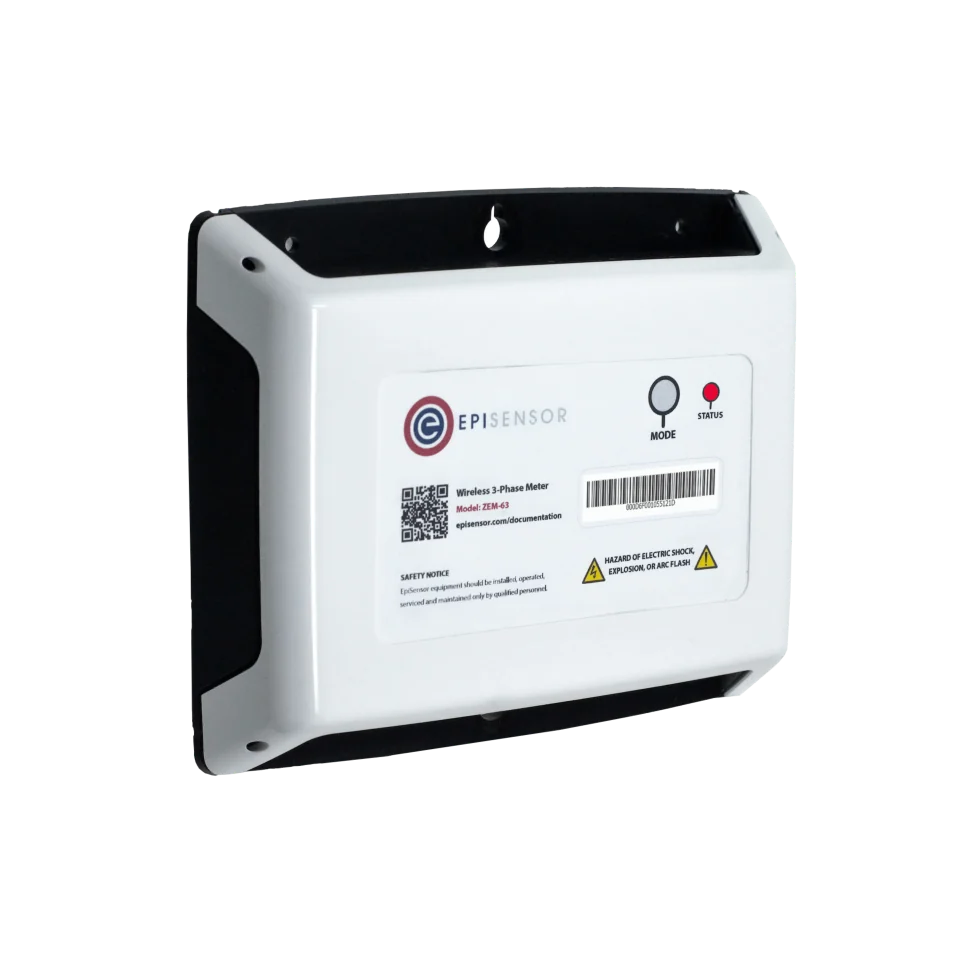
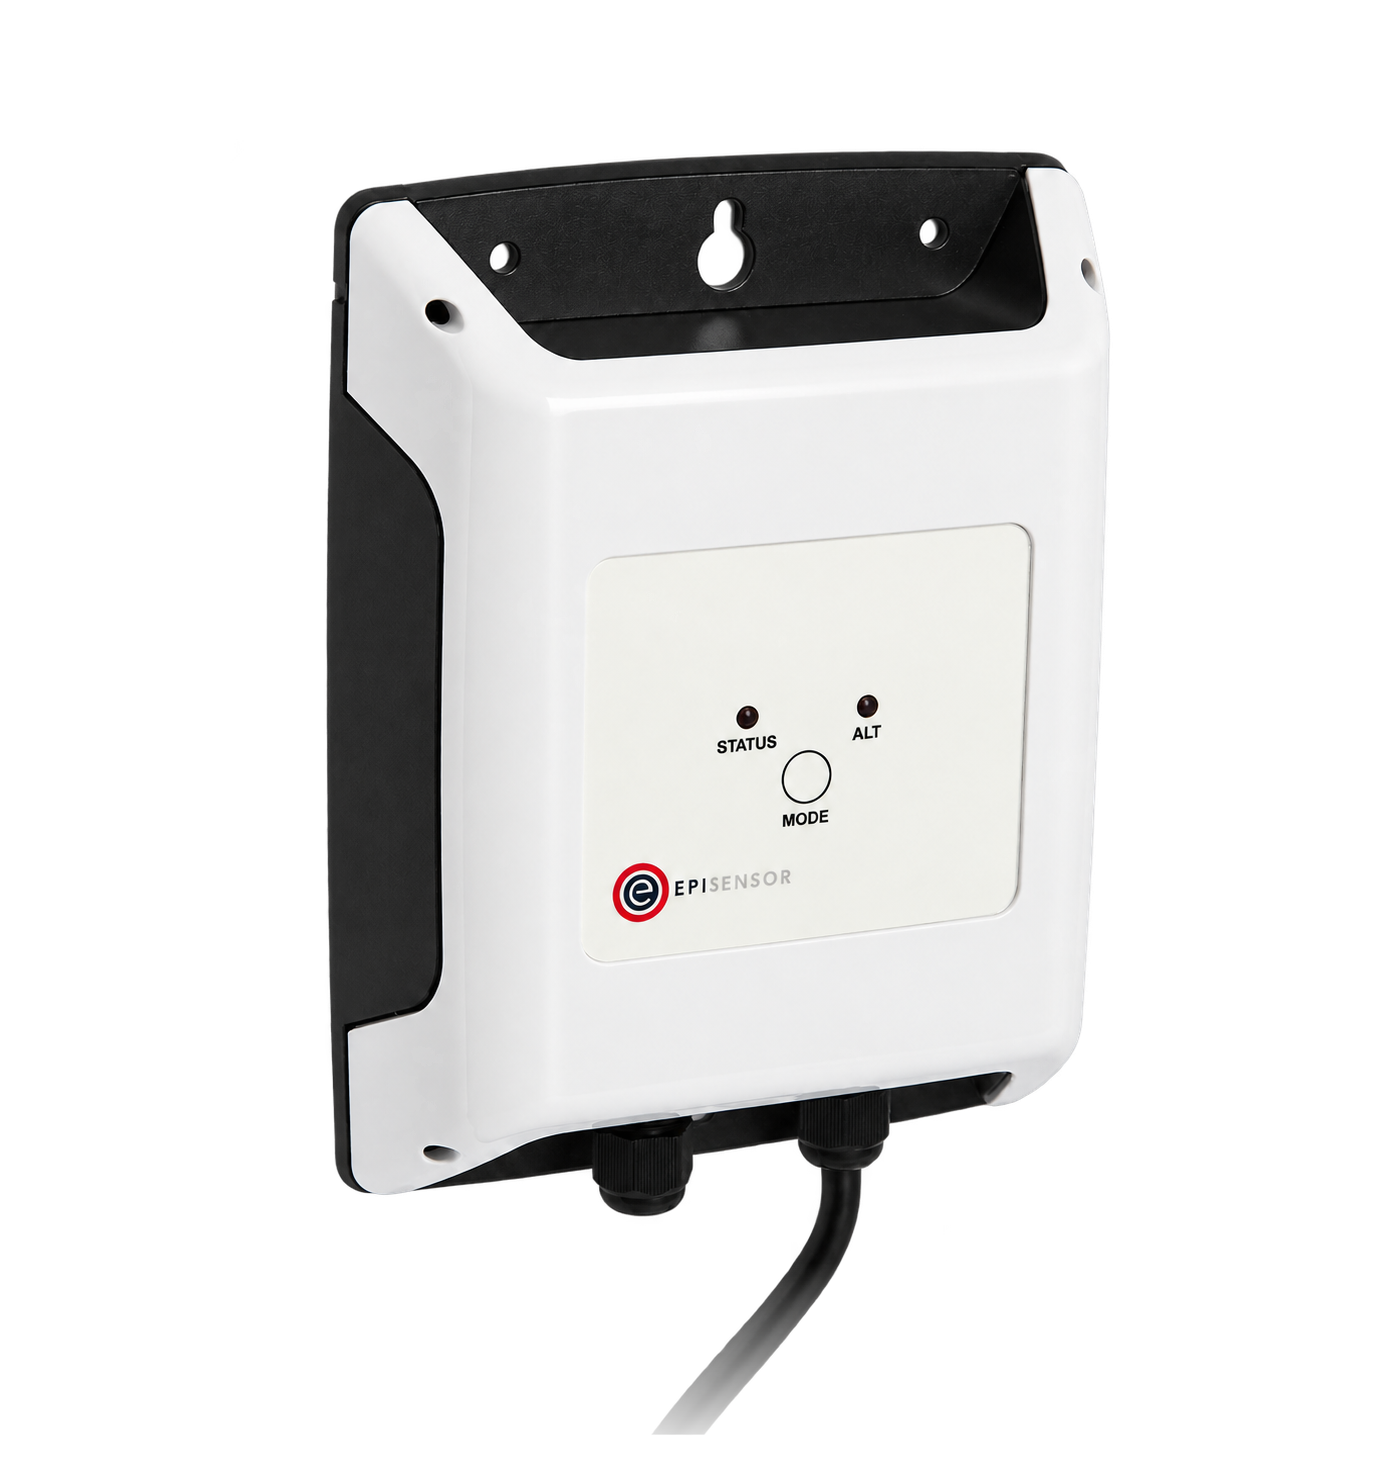
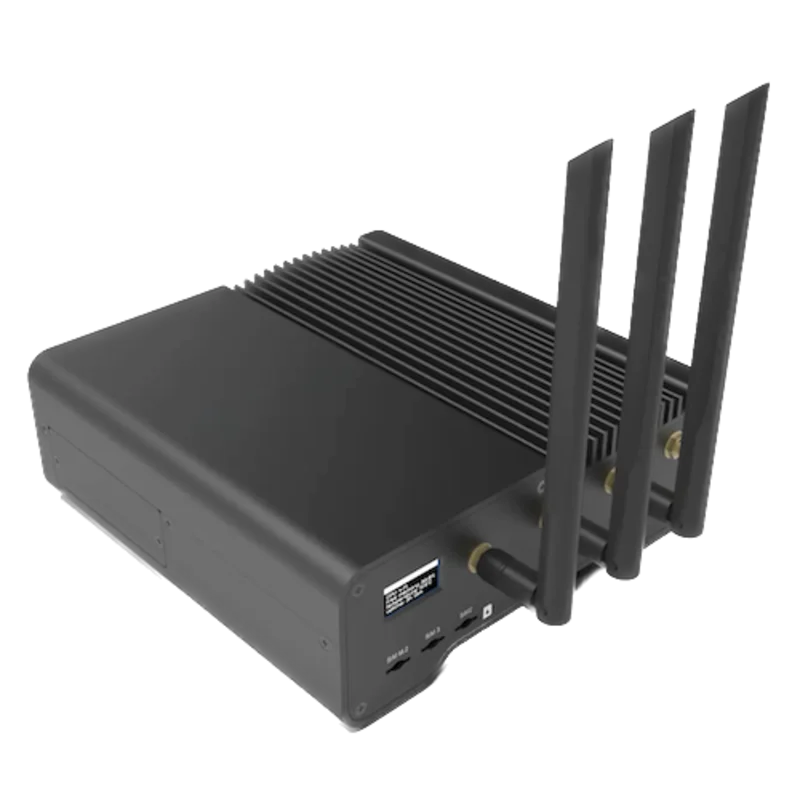
- Measure
- Motor electrical input, flow, suction and discharge pressure, speed and valve state
- Calculate
- Pump specific energy in kWh per cubic metre, and differential head
- Sensors
- ZIO-22, two 4-20 mA loops on one device, 0.001 mA resolution Analogue Signal Sensor datasheet
- On site
- ZGW-20 Gateway, the calculation, with every input kept beside it Gateway datasheet
Hardware for pump energy monitoring
One electricity meter at the motor supply, the instruments that are already in the pipework, and the drive if it will talk.
The motor or starter supply, which is the input side of the ratio
1 per motor three-phase, 3 or 4 wire
- Choose the CT rating for the motor supply: 120 A split-core, or 300 A, 1 kA and 3 kA Rogowski coils
Class 0.5S to IEC 62053-22 with its CTs, 0.1 A to 3 kA
Current-loop inputs for suction pressure, discharge pressure and flow, over two interfaces
2 for the full method three 4-20 mA signals plus one spare channel
0 to 20 mA at 0.001 mA resolution, up to 36 V DC, externally powered loops
Calculates specific energy and head on site, and keeps the raw signals
1 per site up to 250 wireless devices
If the drive has a published register map
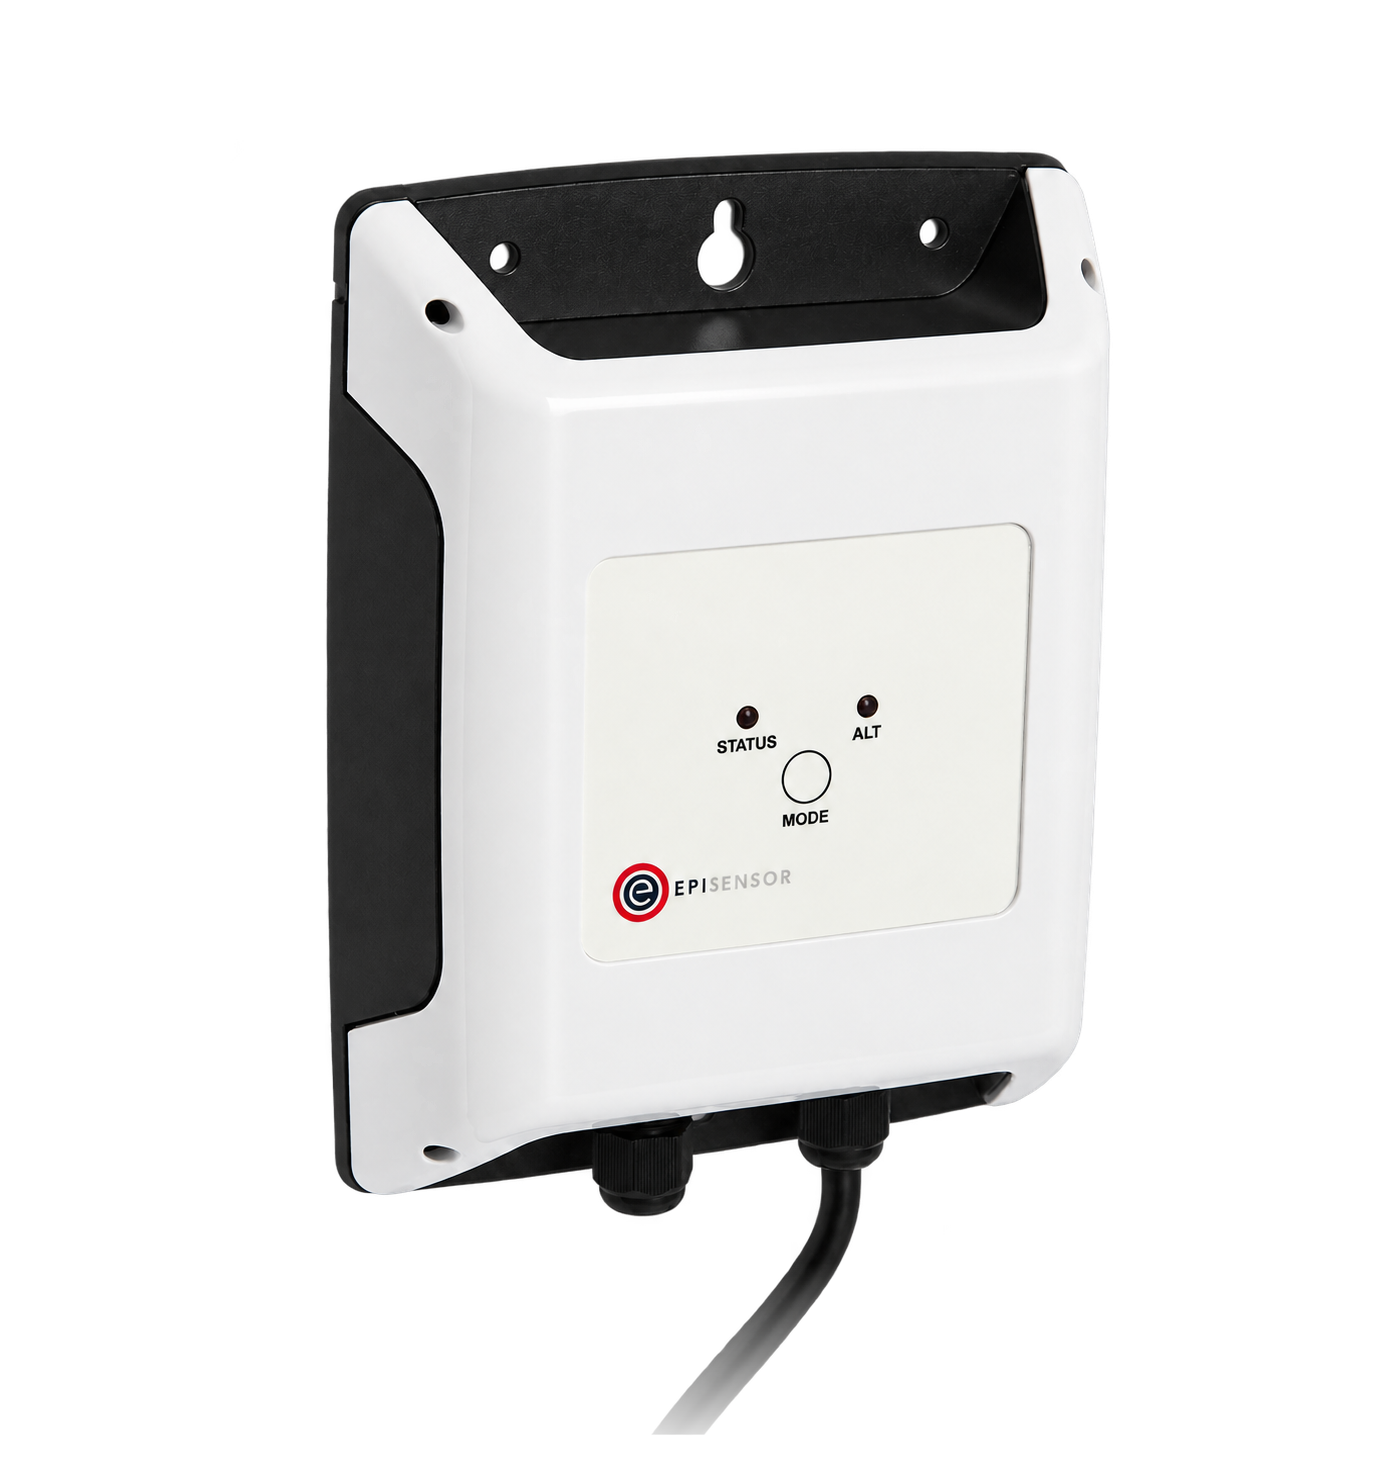
Speed, torque estimate and run state from the variable-speed drive
1 per drive up to 30 registers
If temperature is part of the condition picture
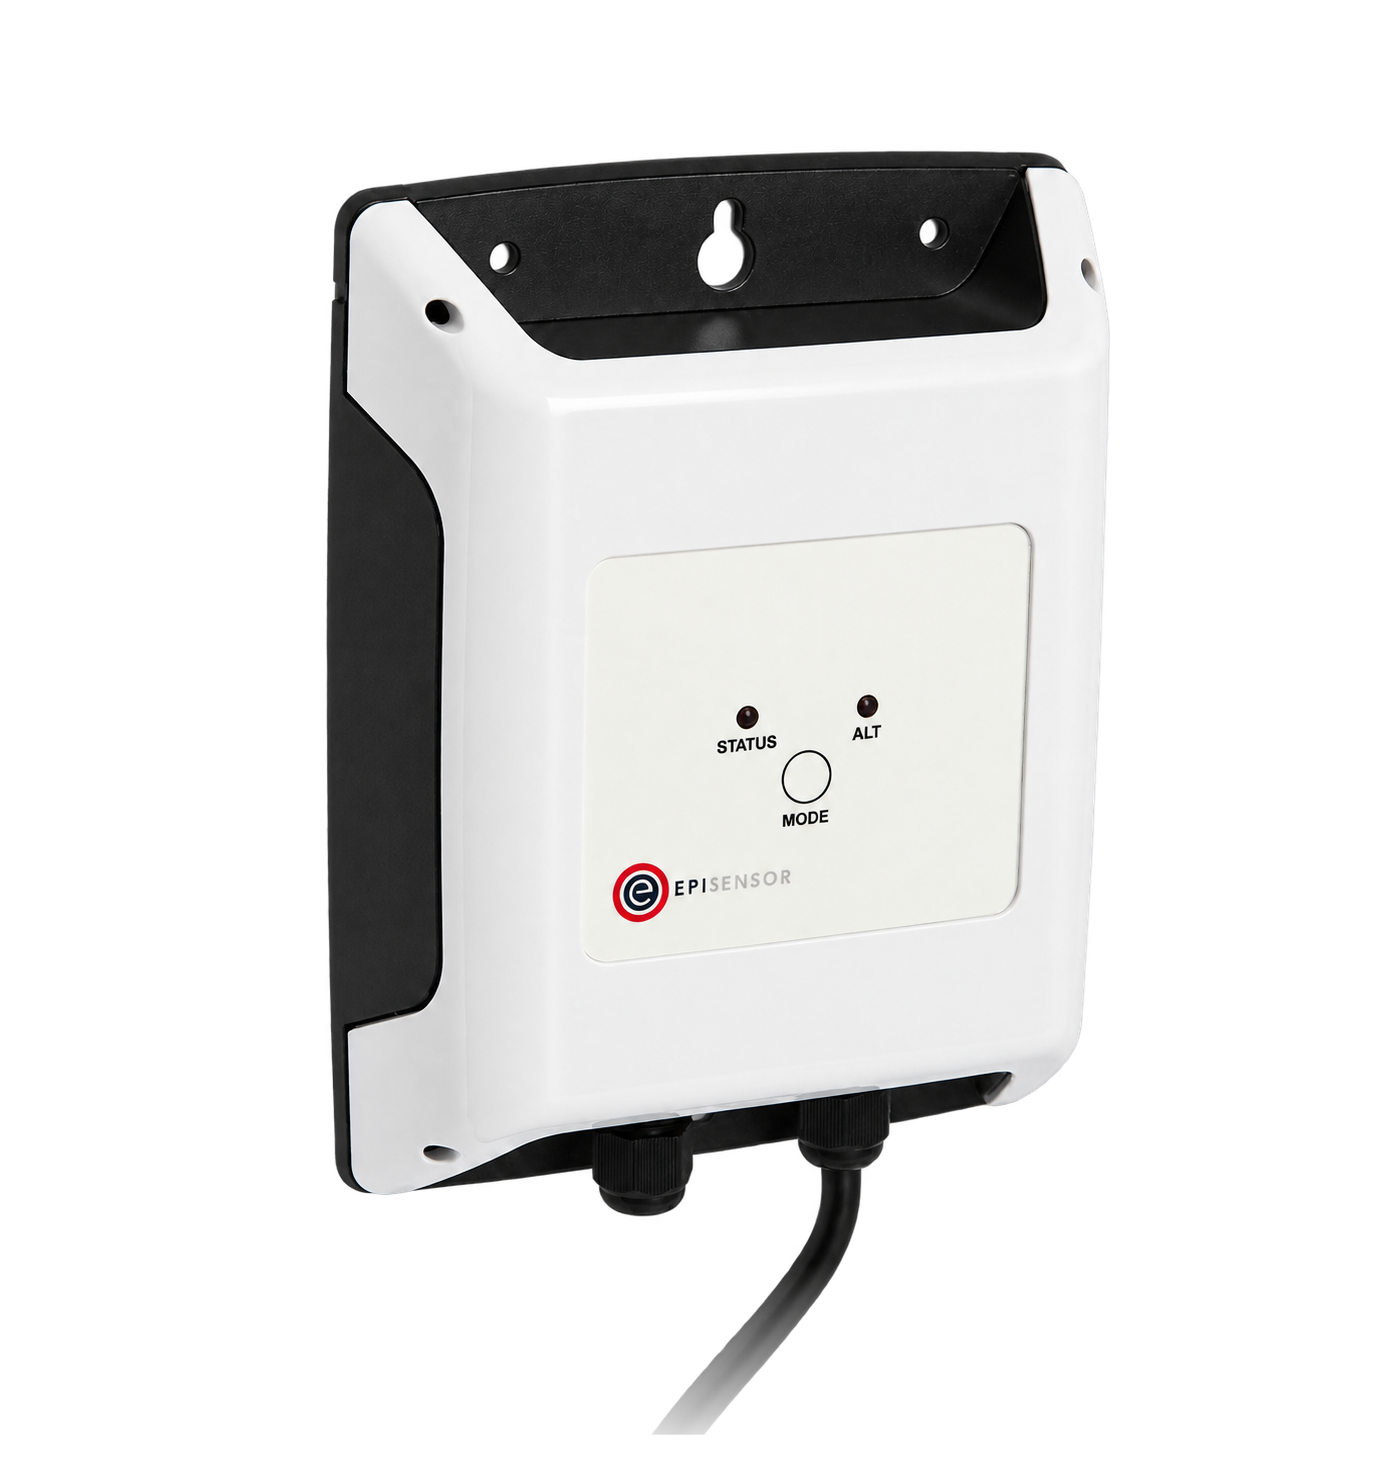
Bearing housing or fluid temperature beside the electrical trend
1 per point steel probe, 2 m lead
±0.2 °C from 0 to 70 °C, ±0.5 °C from −40 to 105 °C
What separates a control change from a fault
Power on its own cannot tell you why it fell. These four measurements can.
From field measurement to Edge
Each field signal reaches its named EpiSensor interface, reports through the site Gateway and is handled locally in Edge.
- Wired
- Zigbee
- Edge
- Platforms
| Position | What it tells you | Reference | Sensor |
|---|---|---|---|
| Motor supply | Input power, energy, starts and running hours | Declare whether the supply feeds anything besides this pump Wireless 3-Phase Electricity Monitor datasheet | ZEM-65 (on this page) |
| Suction and discharge pressure | The differential pressure the pump is producing | Transmitter range, units and elevation recorded per instrument Analogue Signal Sensor datasheet | ZIO-22 (on this page) |
| Flow | The volume actually delivered, which is the denominator of specific energy | Flow meter's own range, zero behaviour and installation requirements | ZIO-22 (on this page), second channel |
| Speed and valve state | Whether the duty point moved because somebody moved it | A commanded speed is not proof of an achieved speed Modbus Interface datasheet | ZMB-31 (on this page) |
Name the fluid before converting pressure to head. Converting bar to metres needs the fluid's density at its operating temperature, and the elevation of each tapping.
Meter the pump on its own supply. If the supply also feeds a second pump or the auxiliaries, the ratio includes them. Say so, or meter closer to the motor.
How to calculate pump specific energy
Specific energy needs an actual flow measurement over the same period as power. The simplified pressure-to-head expression below assumes the pressure taps are at the same elevation and velocity-head change is negligible.
specific energy = P ÷ Q
H = (pd − ps) × 10.2 ÷ SG- P
- electrical input power, kW
- Q
- delivered flow, cubic metres per hour
- pd, ps
- discharge and suction pressure, bar
- H
- differential-pressure head, metres of the fluid, when elevation and velocity-head differences are negligible
- SG
- fluid specific gravity at the operating temperature
Worked example
A pump drawing 22.0 kW while an installed flow meter reads 140 m³ per hour uses 0.157 kWh per cubic metre. With same-elevation pressure taps, negligible velocity-head difference, suction at 1.2 bar and discharge at 4.6 bar on water, the differential-pressure head is (4.6 − 1.2) × 10.2 = 34.7 metres.
In Edge
A calculated sensor divides power by flow, with a guard so a stopped pump does not divide by zero, and a second one takes the pressure difference. Keep the run state as its own point so stopped periods can be excluded on purpose.
Commissioning checks
Commission the instruments first: the ratio is only as good as its flow signal.
-
The meter is on this motor
Start and stop the pump and watch the electrical measurement.
Pass when the power follows the pump, and the standing consumption when it is off is explained.
-
Transmitters are zeroed and scaled
Follow each transmitter's own zero and span procedure, then compare its display with the value in Edge.
Pass when both agree at two points, and 4 mA reads as the transmitter's zero rather than as zero flow.
-
Two speeds, one story
Run at two known speeds or valve positions and record power, flow and pressure at each.
Pass when every signal moves in the direction and the order the hydraulics predict.
-
A lost signal is not a low reading
Disconnect one transmitter loop.
Pass when the value is withheld or marked, and specific energy stops rather than rising.
-
The baseline is described
Write down the impeller, fluid, control mode and system condition the baseline period ran in.
Pass when a later comparison can say whether it is comparing like with like.
Limits of this measurement
Specific energy is evidence for a question, not the answer to it.
- Affinity laws describe a similar operating point. Where static head or efficiency changes matter, they stop predicting the duty point.
- Monitoring does not replace NPSH, cavitation, minimum-flow or mechanical assessment.
- A changed ratio is a reason to investigate, not proof of a fault or of a saving.
- A flow meter installed against its own requirements produces a confident number that is still wrong.
Sources
- Improving pumping system performance (opens in a new tab) US Department of Energy
- Wireless 3-Phase Electricity Monitor datasheet (opens in a new tab) EpiSensor. Specifications, ranges and ordering codes.
Related
-

Compressed air energy monitoring
Measure compressor electricity alongside delivered air and header pressure, then compare complete operating periods before deciding what to investigate. -
4-20 mA remote monitoring for process instruments
Current-loop and voltage instruments read by a mains-powered analogue signal sensor, with the range, the scaling and the fault current recorded beside the value.
- OverviewEnergy monitoring
- Calculator4-20 mA loop voltage calculator
- GuideEquipment performance monitoring boundaries
Third-party devices for this application
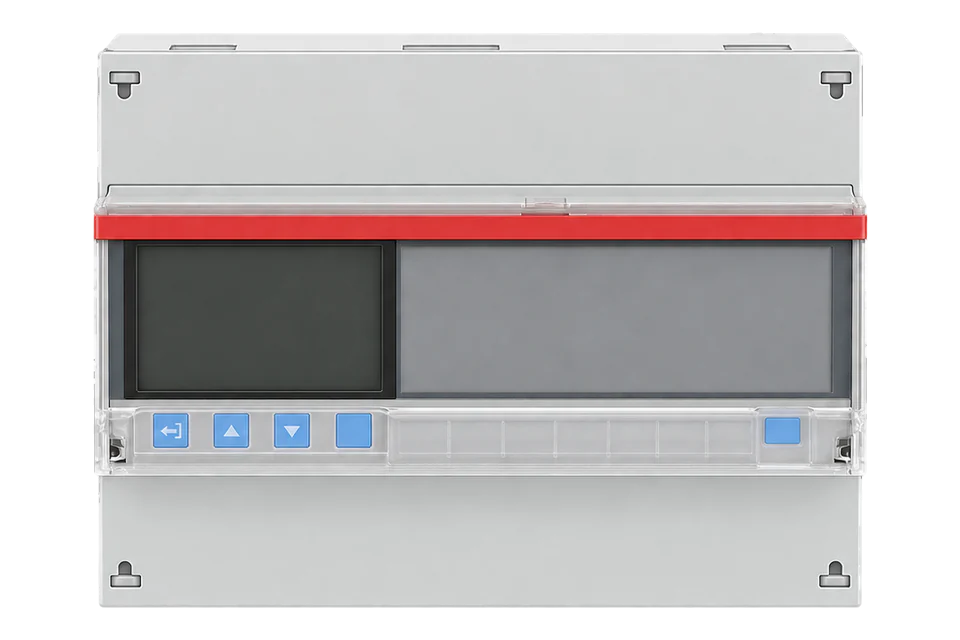
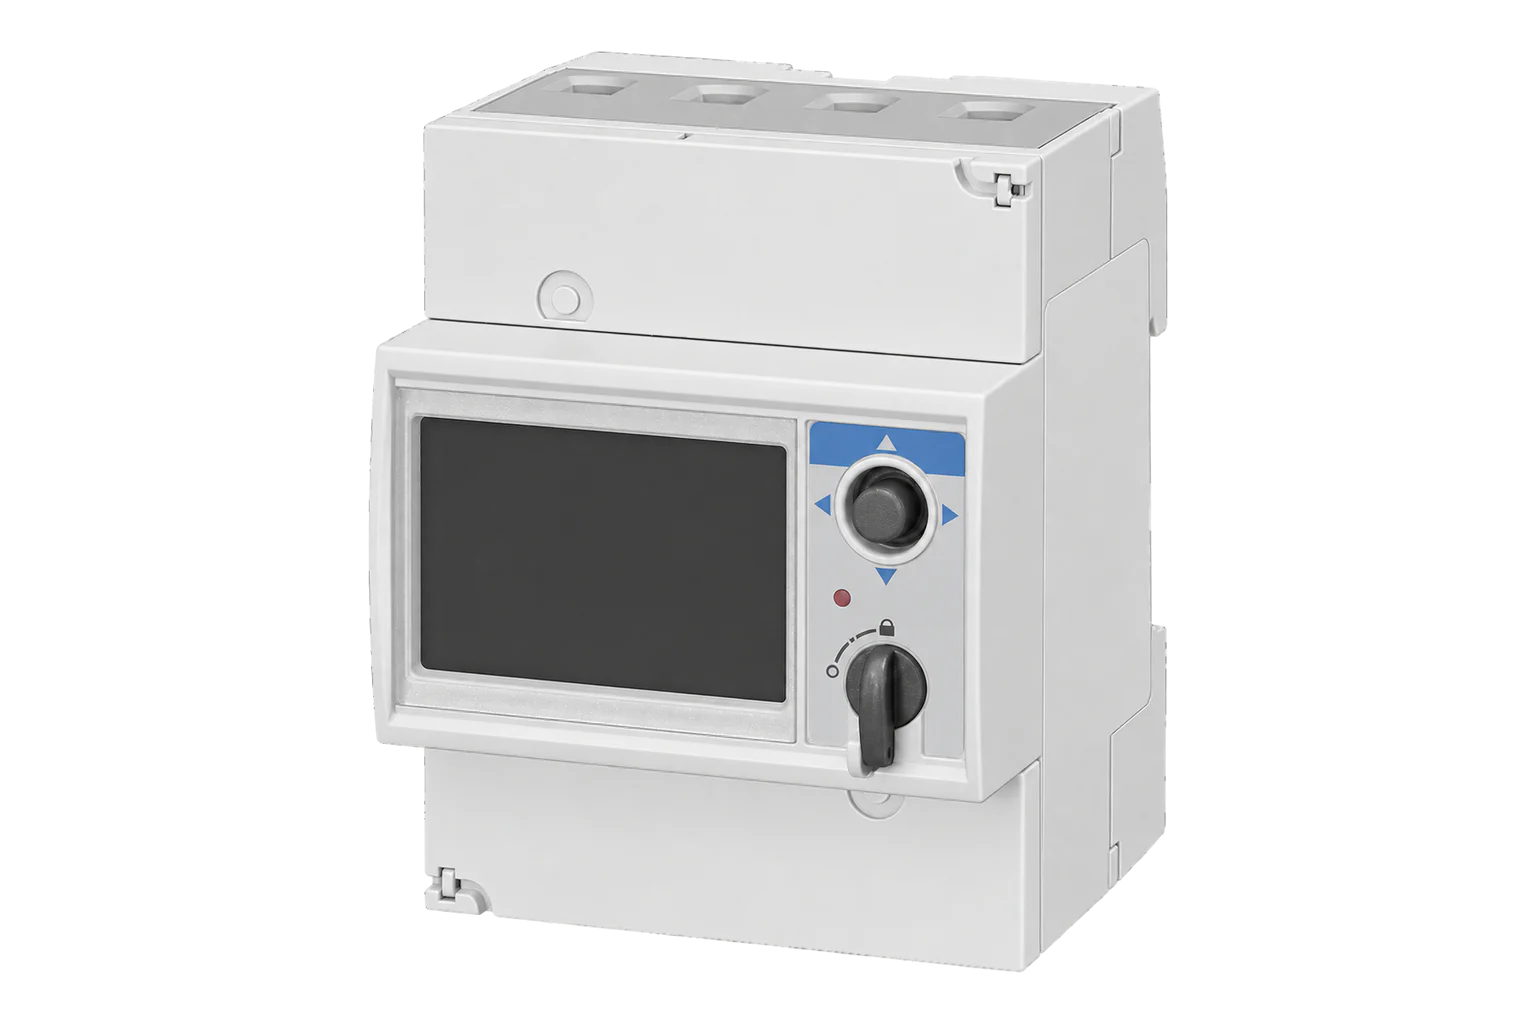
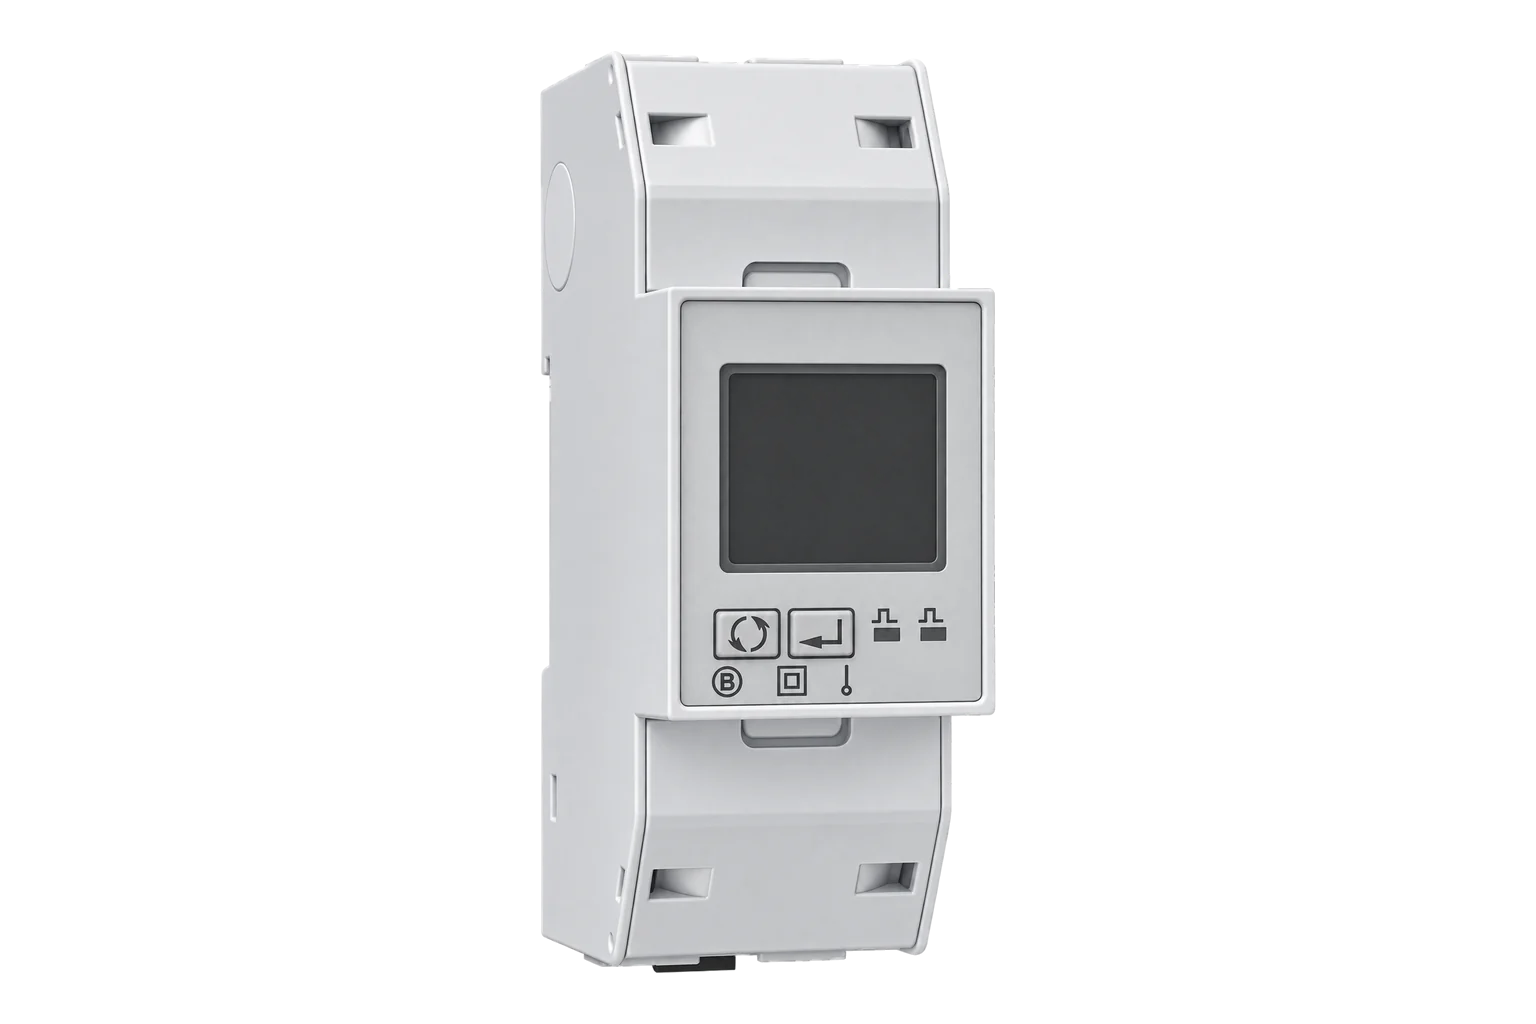
More in the Device Directory: Energy meters (62), Current transformers (7)
Explain a pump's power draw instead of guessing at it
An engineer can check the signals are usable, size the meter and the CTs, and write the calculation with you.