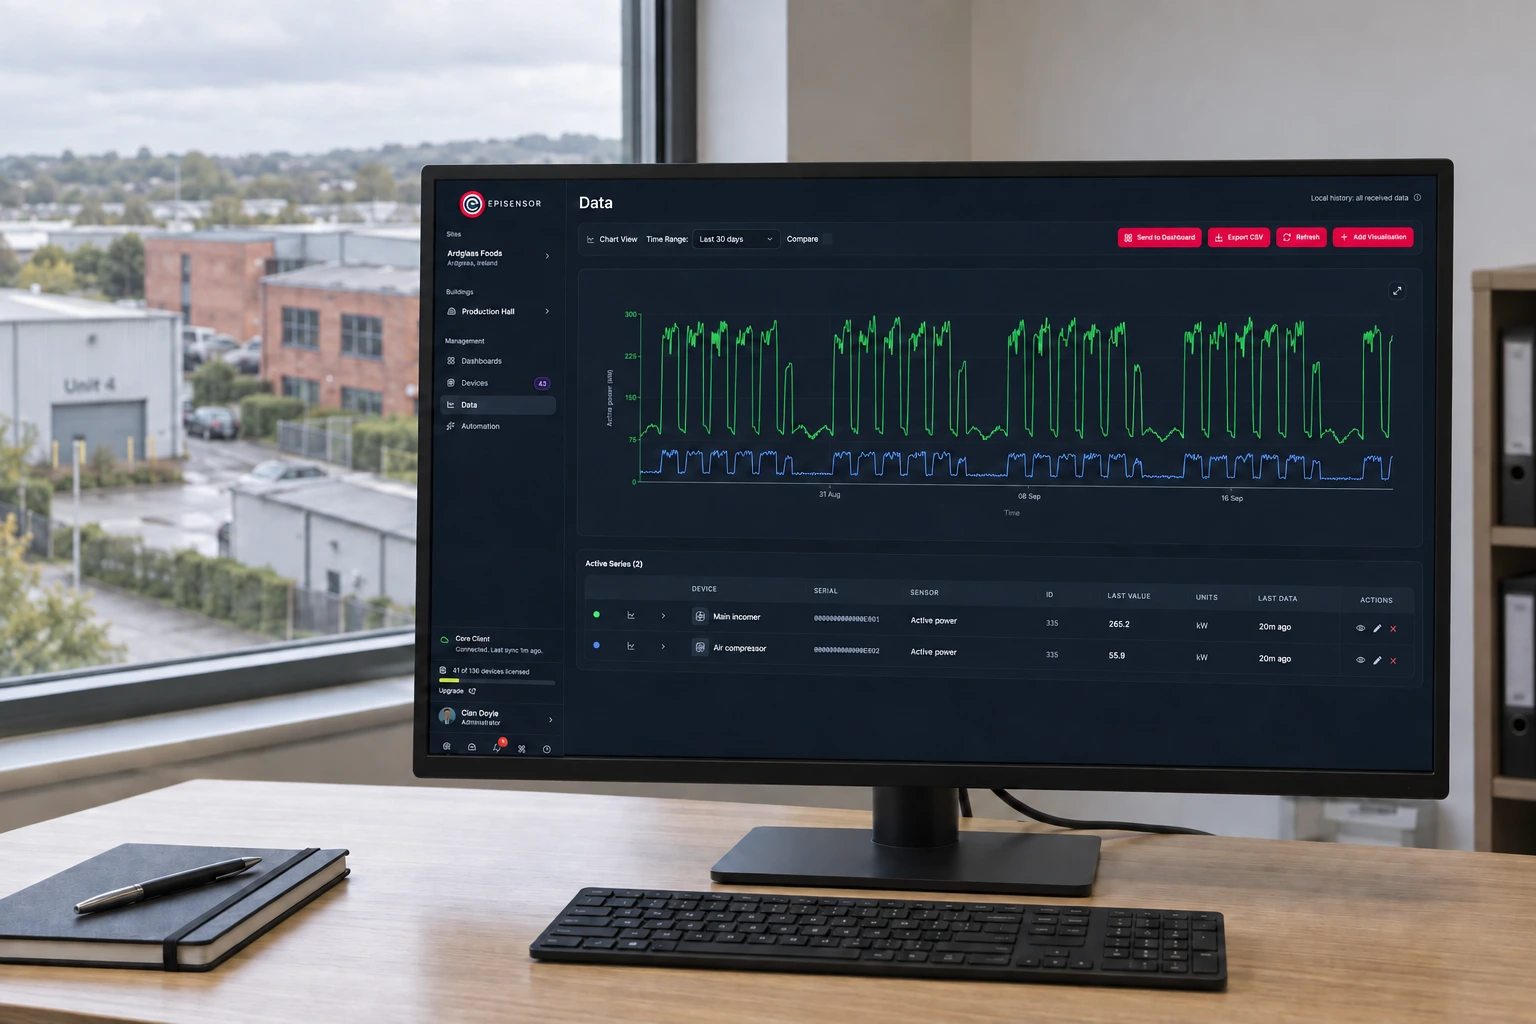
Multi-site energy monitoring
A Gateway on every site supports remote energy monitoring with local data continuity, a consistent point register and named owners for connections, credentials and change.
- Measure
- Site incomers, the subloads that explain a difference, and the other utilities
- Scale
- One Gateway per site, up to 250 wireless devices on each Gateway datasheet
- Sensors
- ZEM-65, for new electrical points, existing meters through their own interface Wireless 3-Phase Electricity Monitor datasheet
- On site
- Remote energy monitoring keeps running when the WAN is down, and backfills afterwards Gateway datasheet
Remote energy monitoring for multiple buildings
A portfolio dashboard is the last step, not the starting point. Specify how each reading is identified and retained at the site, how the receiver acknowledges it, and how the team sees communication, credential and configuration failures. The acceptance test must follow one known reading from its physical meter to the portfolio view and back again.
| Operating layer | Evidence to retain | Failure test |
|---|---|---|
| Field site | Meter identity, physical boundary, source settings, units and point mapping | Replace or reset one source and confirm that its identity and history remain understandable |
| Site continuity | Local collection state, available history, original timestamps and the configured backfill boundary | Interrupt the WAN for a declared period, restore it and reconcile the recovered intervals |
| Portfolio delivery | Endpoint, authentication, schema, retry identity, receipt state and destination mapping | Prove that a delivered payload is imported under the intended site and point, rather than relying on transport success |
| Fleet operations | Gateway and flow version, last contact, credential owner, alarm owner and approved change record | Exercise credential renewal, a missed report and a controlled update on the pilot before rollout |
Hardware for energy monitoring across multiple buildings
Every site gets a Gateway. What hangs off it depends on what each building already has.
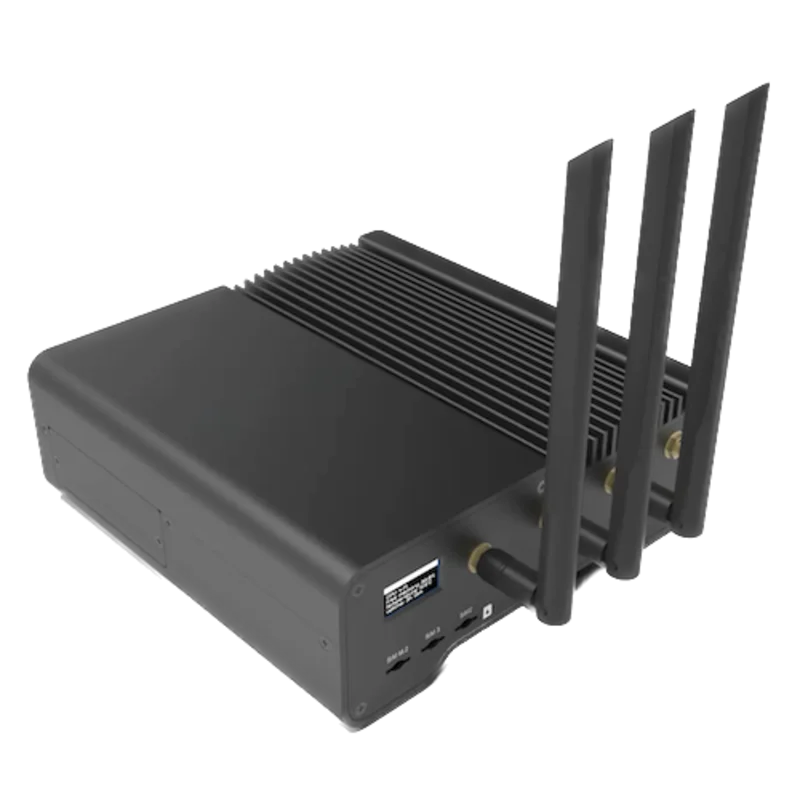
One per site: collects the meters, applies the point list and holds the data locally
1 per site up to 250 wireless devices
Zigbee, Ethernet, Wi-Fi and cellular, with Modbus, BACnet and MQTT for the wired side
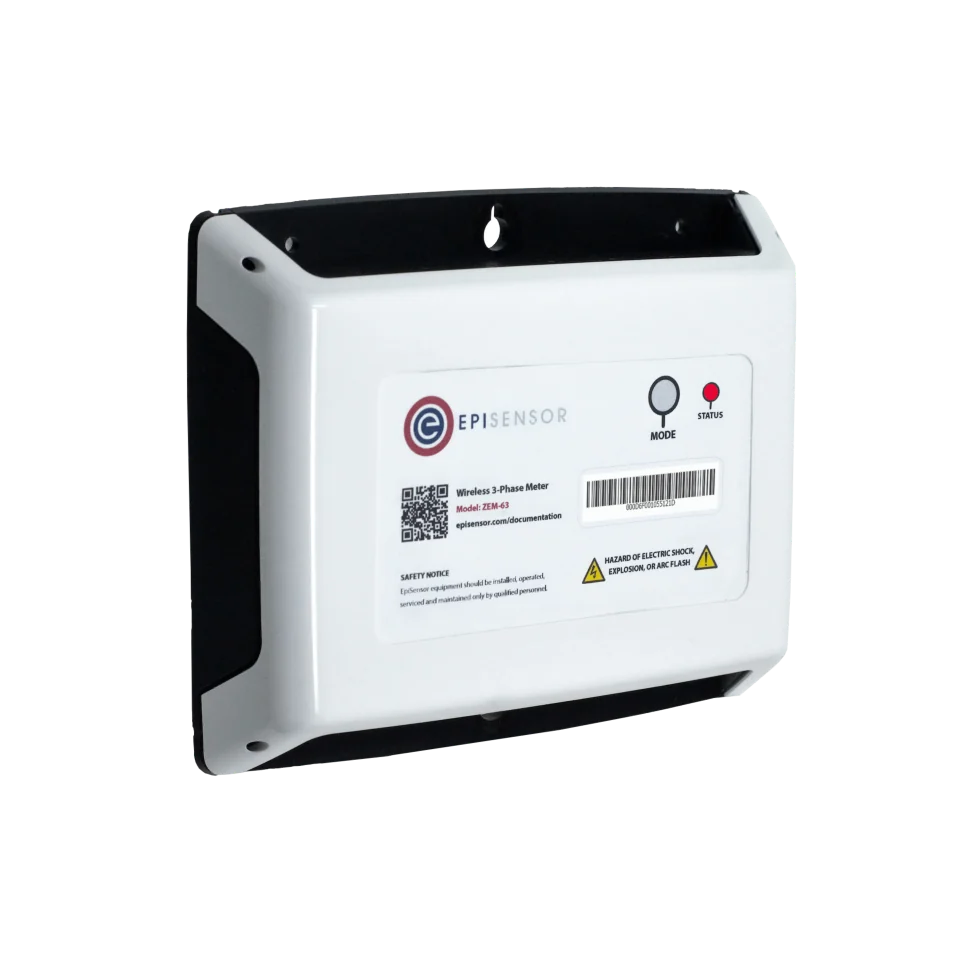
New electrical measurements at an incomer or a subload, without running data cable
1 per point three-phase, 3 or 4 wire
- Choose the CT rating per board: 120 A split-core, or 300 A, 1 kA and 3 kA Rogowski coils
Class 0.5S to IEC 62053-22 with its CTs, 0.1 A to 3 kA
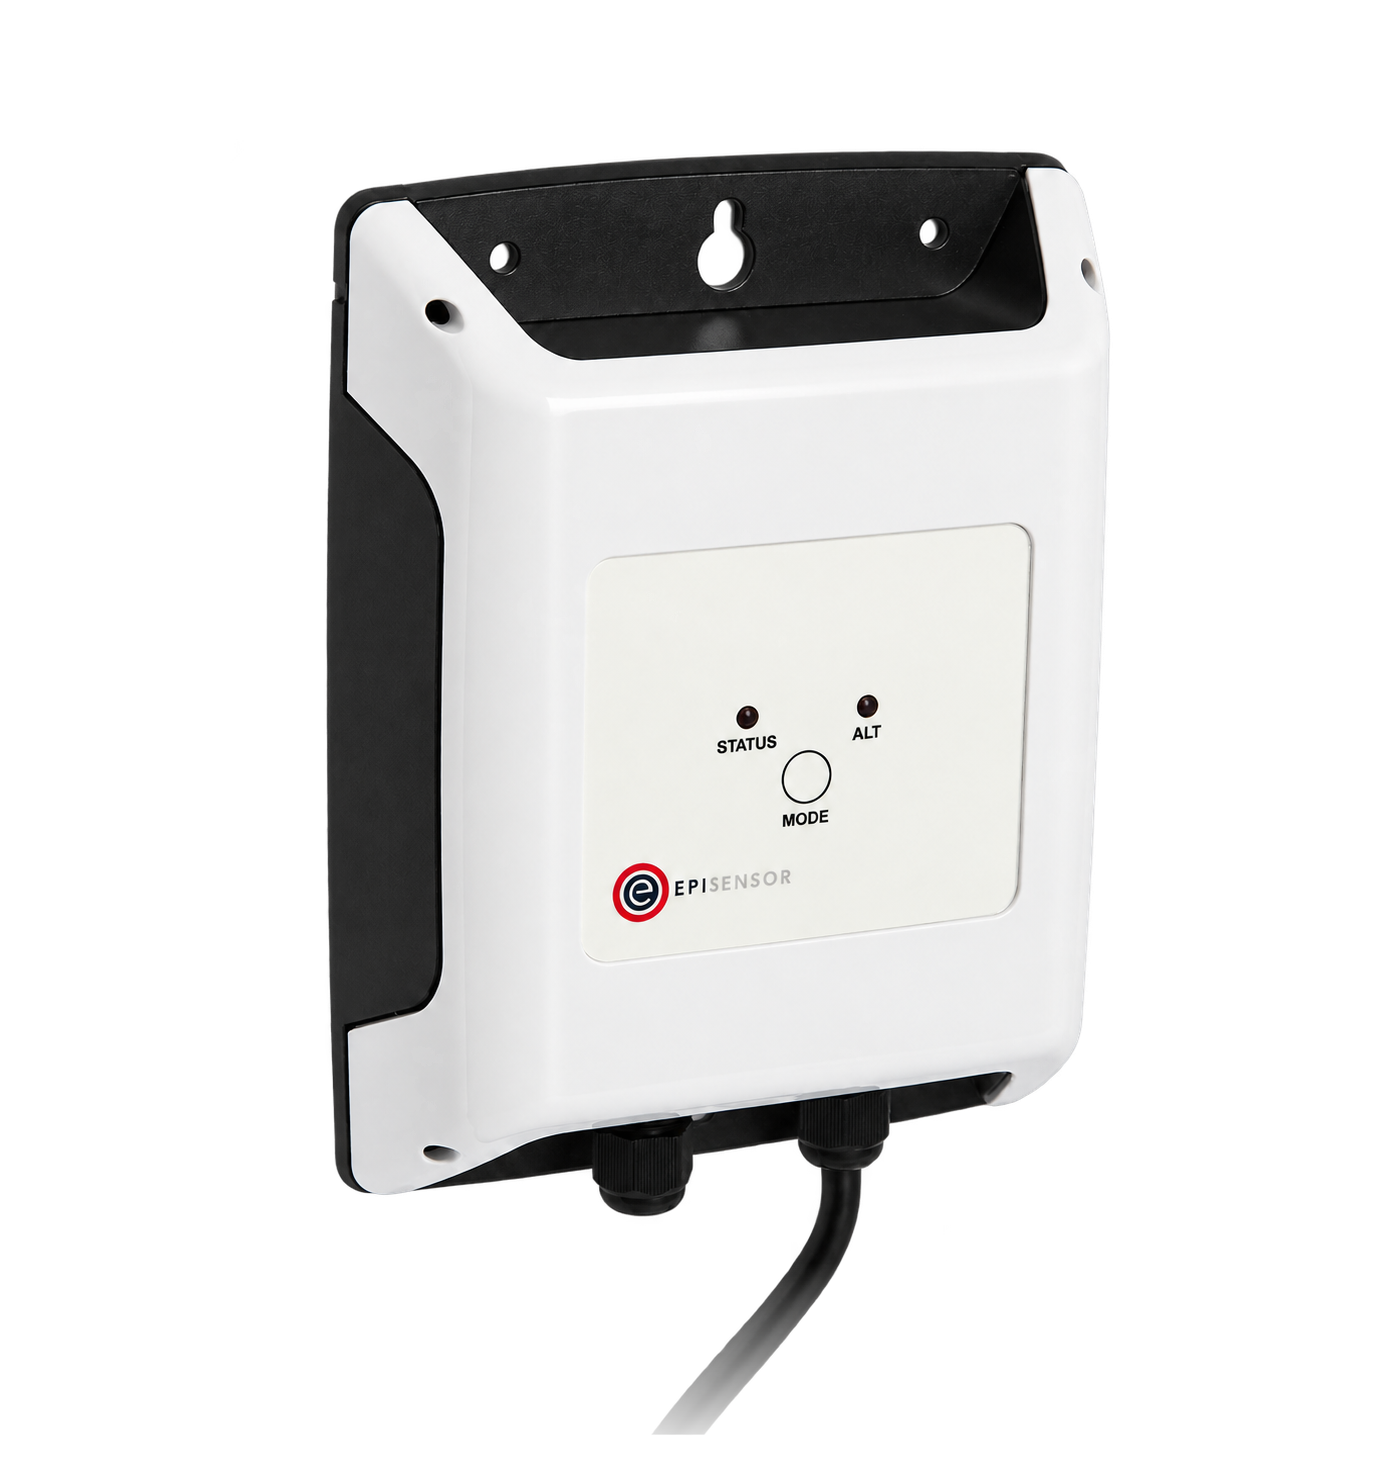
Existing meters and equipment that already speak Modbus RTU on site
1 per bus up to 30 registers
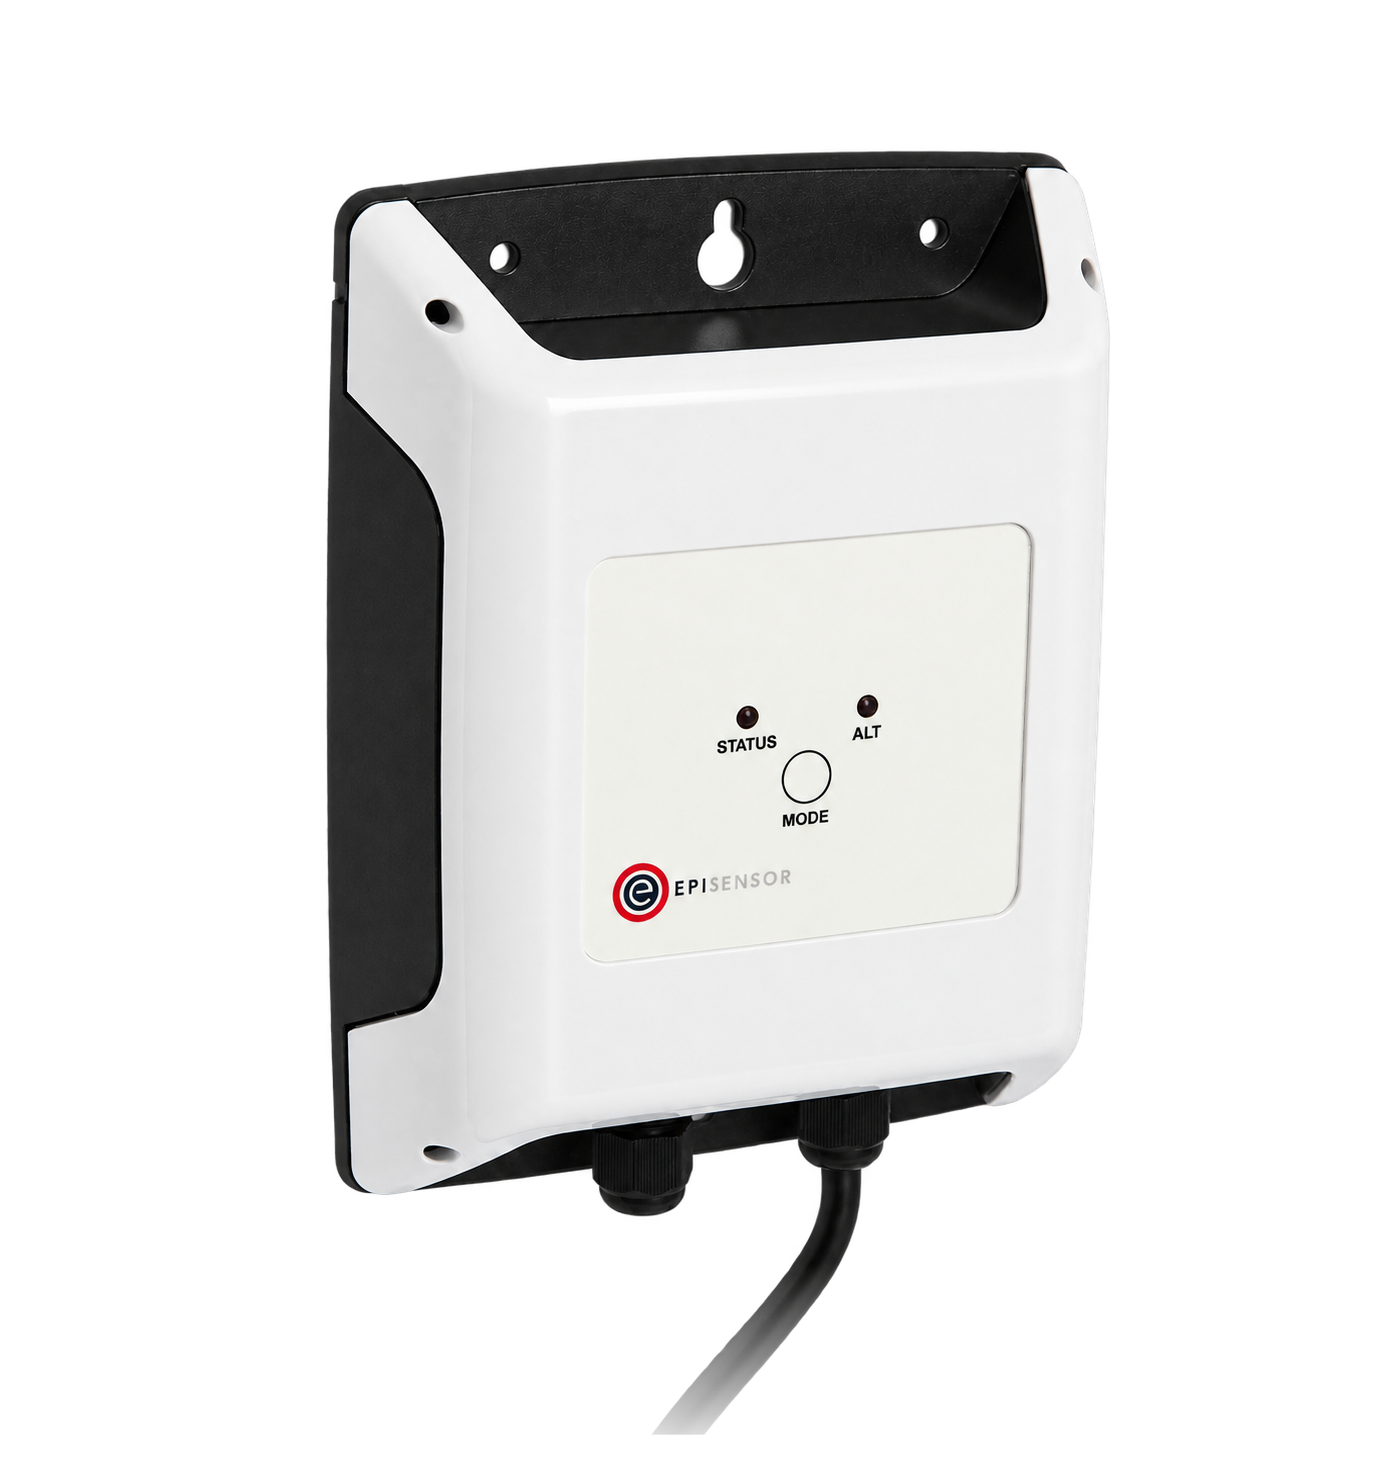
Water, gas and heat meters that only have a pulse output
1 per meter two channels on the ZPC-22
Pulses down to 10 ms wide, up to 40 Hz, inputs to 35 V DC
If a site has heat meters
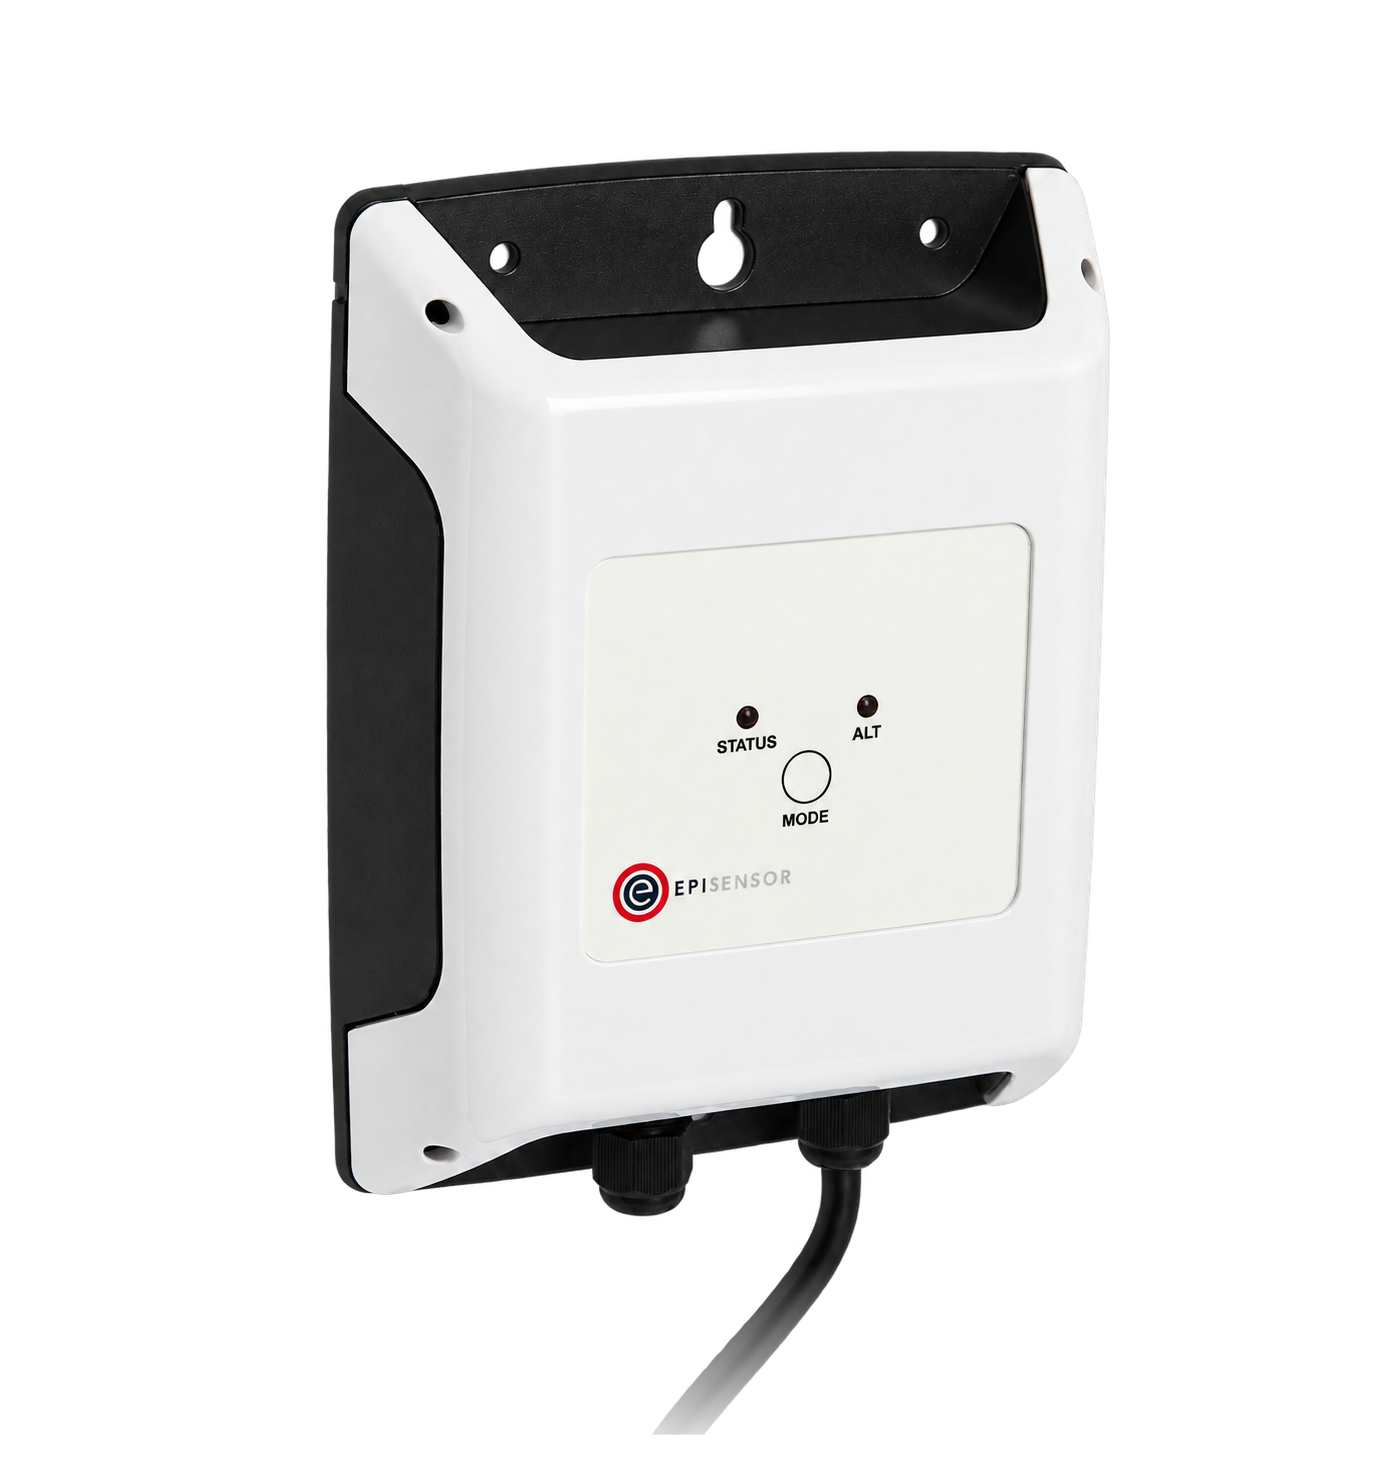
Wired M-Bus heat meters on district heating or a plant room
1 per meter one connected meter each
The point list every site shares
A portfolio view only works when the same name means the same thing everywhere. Agree this list before the first site is fitted.
From field measurement to Edge
Each field signal reaches its named EpiSensor interface, reports through the site Gateway and is handled locally in Edge.
- Wired
- Zigbee
- Edge
- Platforms
| Position | What it tells you | Reference | Sensor |
|---|---|---|---|
| Site incomer | Whole-site demand and energy, on the same interval at every site | One meter per supply, with the same demand interval everywhere | ZEM-65 (on this page) |
| Material subloads | Why one site differs from another: the loads worth explaining | Chosen from a question the site is trying to answer, rather than from the board layout | ZEM-65 (on this page), one per load |
| Existing meters | What the site already measures, without replacing a meter | Register map or pulse weight recorded per meter Modbus Interface datasheet | ZMB-31 (on this page) |
| Other utilities | Water, gas and heat beside the electricity, on the same clock | Cumulative totals kept as totals, with the pulse weight written down Pulse Counter datasheet | ZPC-20 (on this page) |
Name each point by what it measures. "Site incomer" survives a meter replacement. A serial number in a point name does not.
Agree the interval once. Comparing a 15-minute site with a 30-minute site needs a stated method, so pick one interval and one time zone at the start.
What each site's Gateway does on its own
The site keeps working whether or not anyone is looking at the portfolio that day.
- Acquisition keeps running without the WAN
- Reading, storing and local automation run on the Gateway. A site with a dropped connection keeps measuring and sends the gap when it returns, within the configured storage and export limits.
- One point register is applied per site
- Each site maps its own meters into stable names, units and measurement boundaries, so the portfolio compares like with like and a replaced meter can retain the same operational identity.
- A gap is not a zero
- A no-data rule reports a device that has stopped reporting. The receiving workflow preserves missing and stale states instead of turning them into quiet consumption.
- Delivery and import are checked separately
- A successful HTTPS, MQTT or file transfer shows that data left the site. Commissioning also confirms that the receiver accepted it under the intended site, point, unit and interval.
- Fleet changes have an owner
- Record the installed Gateway and flow version, credential owner, alarm route and approved configuration. Test a change on a pilot before applying it across the estate.
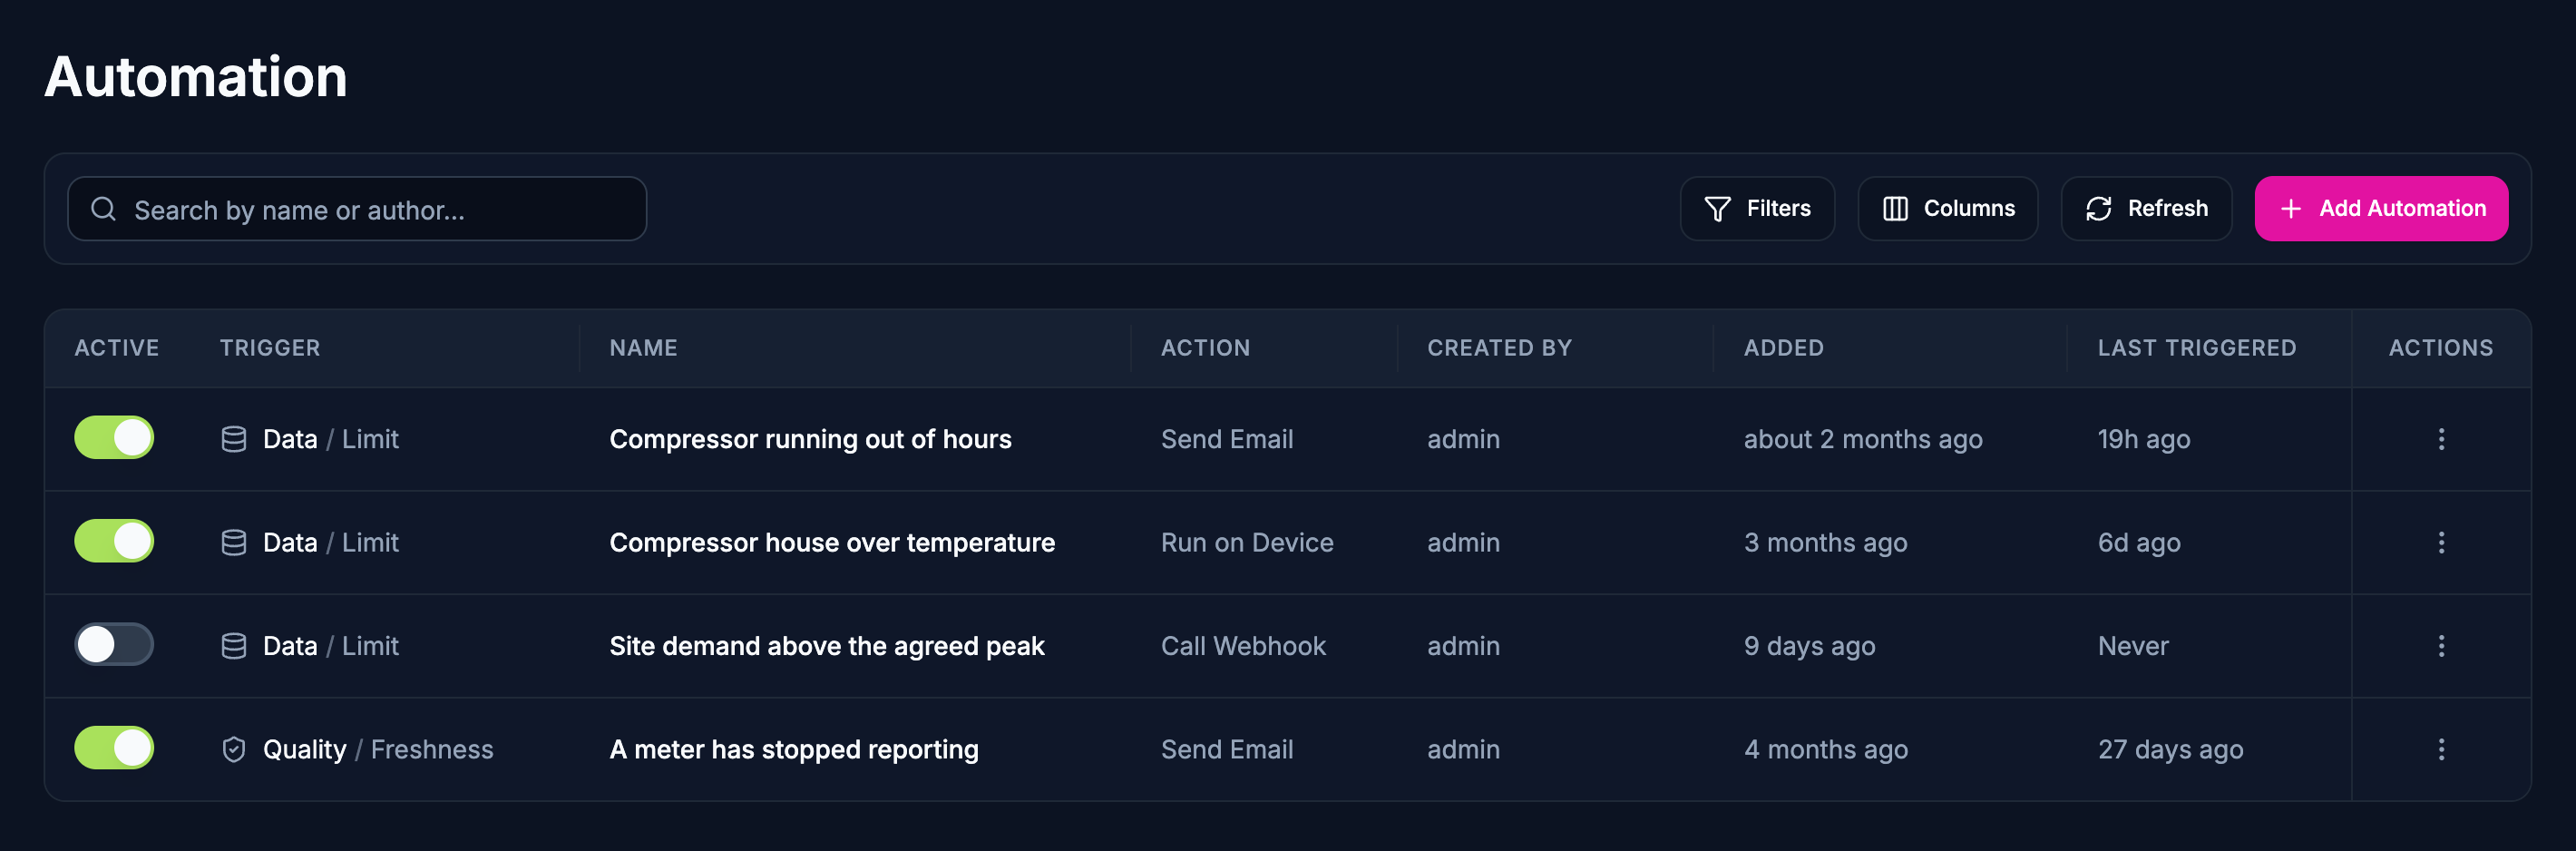
Commissioning checks
Qualify the first site end to end, then repeat the controlled acceptance record at every site.
-
The incomer reconciles
Compare a complete period at the site incomer with the supplier or source meter figure for exactly the same boundary and period.
Pass when the values agree within the declared measurement and timing tolerance, and every difference is explained.
-
Source and receiver agree
Select one known reading and compare its point identity, value, unit, source timestamp and quality at the source, in Edge and in the receiving system.
Pass when all three representations agree, or a documented transformation explains the difference.
-
Time is the same everywhere
Check the time zone, daylight-saving treatment and interval boundaries on two sites and in the receiving platform.
Pass when the same instant and reporting interval have the same meaning throughout the path.
-
A lost connection recovers within its boundary
Disconnect the pilot site WAN for the declared test period, continue collecting, then reconnect it.
Pass when the expected intervals arrive with their original timestamps and reconcile to the local record, within the configured storage and retry limits.
-
A missing device is visible
Take one test device off the network for longer than the no-data threshold.
Pass when the local and portfolio views show a gap or stale state and the assigned team receives the intended alarm.
-
Credentials and changes have owners
Record who renews credentials, approves point-map and flow changes, handles failed delivery and maintains the receiving mapping. Exercise one safe credential renewal or controlled configuration change on the pilot.
Pass when the data path resumes without silent remapping, duplication or an unexplained gap, and the change record identifies the installed version.
Limits of this measurement
A portfolio view compares sites. It does not make them comparable.
- Two buildings with different uses, sizes and occupancy are not equivalent because their meters now match. Normalise only with a stated method.
- A central dashboard is not evidence that every site’s data was complete, current or correctly mapped.
- Transport success is not proof that the receiver imported a reading under the intended site, point, unit and interval.
- Remote access, credentials and software updates need an agreed security and ownership process for the deployed network.
- Savings attribution needs a baseline and a record of what changed, from outside the monitoring system.
- Tenant billing has its own requirements: see the submetering guide before an allocated number reaches an invoice.
Sources
- ISO 50001 energy management systems (opens in a new tab) (opens in a new tab) ISO
- Wireless 3-Phase Electricity Monitor datasheet (opens in a new tab) EpiSensor. Specifications, ranges and ordering codes.
Related
-
Tenant submetering and cost allocation
Meter each tenancy, the landlord supply and common services, and export a dated record that reconciles with the main meter. -
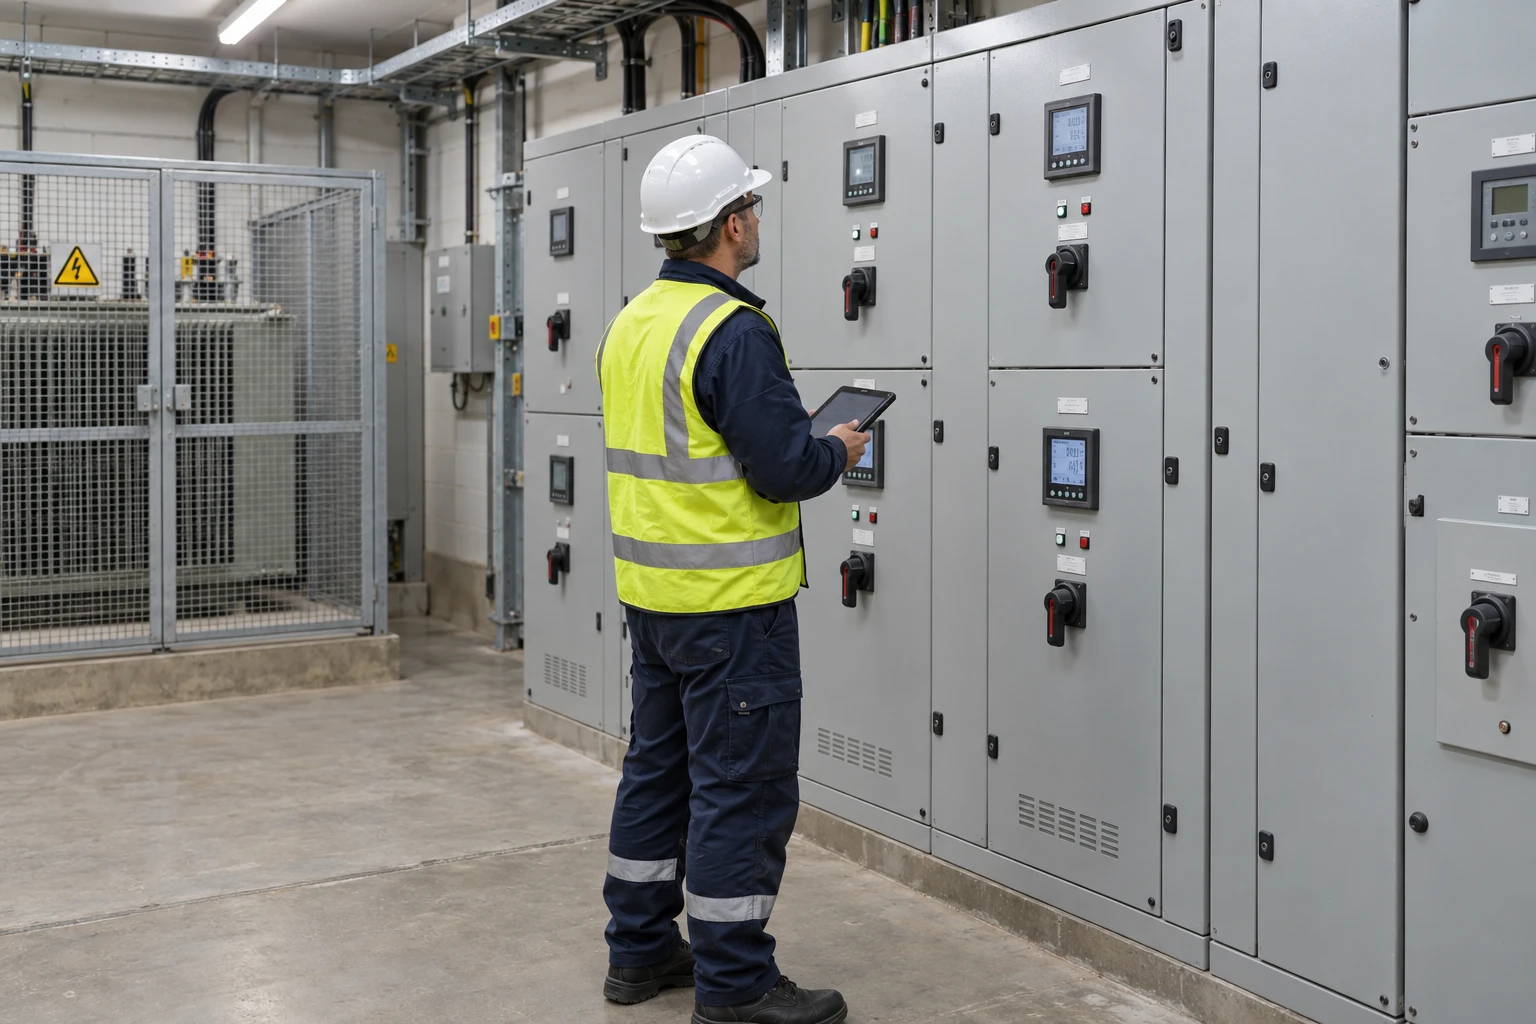
Transformer and distribution board monitoring
A meter at the incomer, meters on the feeders worth explaining, and a temperature probe where loading has to be read against heat.
- OverviewEnergy monitoring
- CalculatorInterval demand calculator
- CalculatorLoad factor calculator
- GuideCloud API vs local gateway for energy sites
- GuideStore-and-forward buffer sizing for edge gateways
Deployed at




Third-party devices for this application
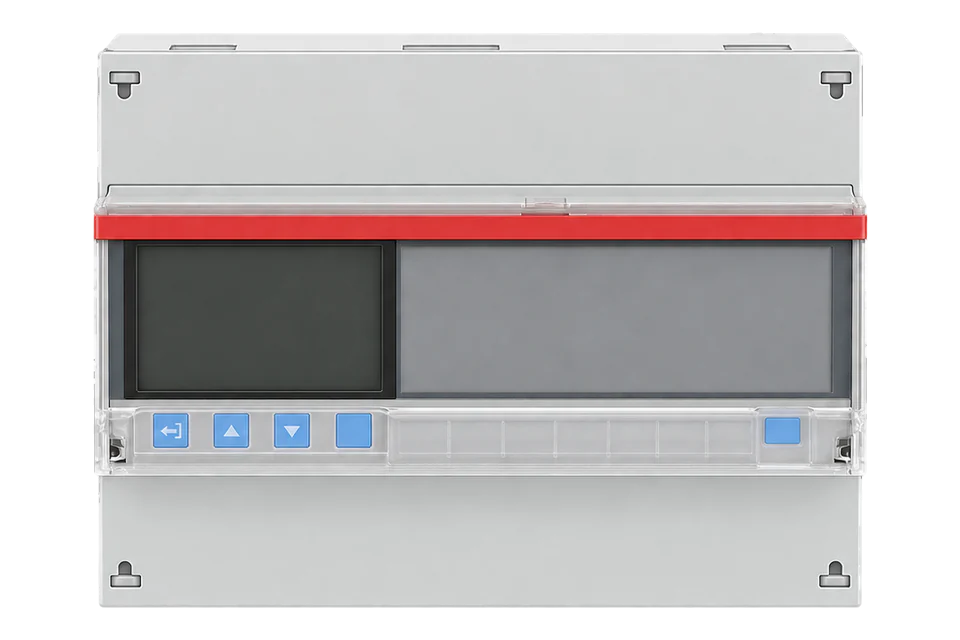
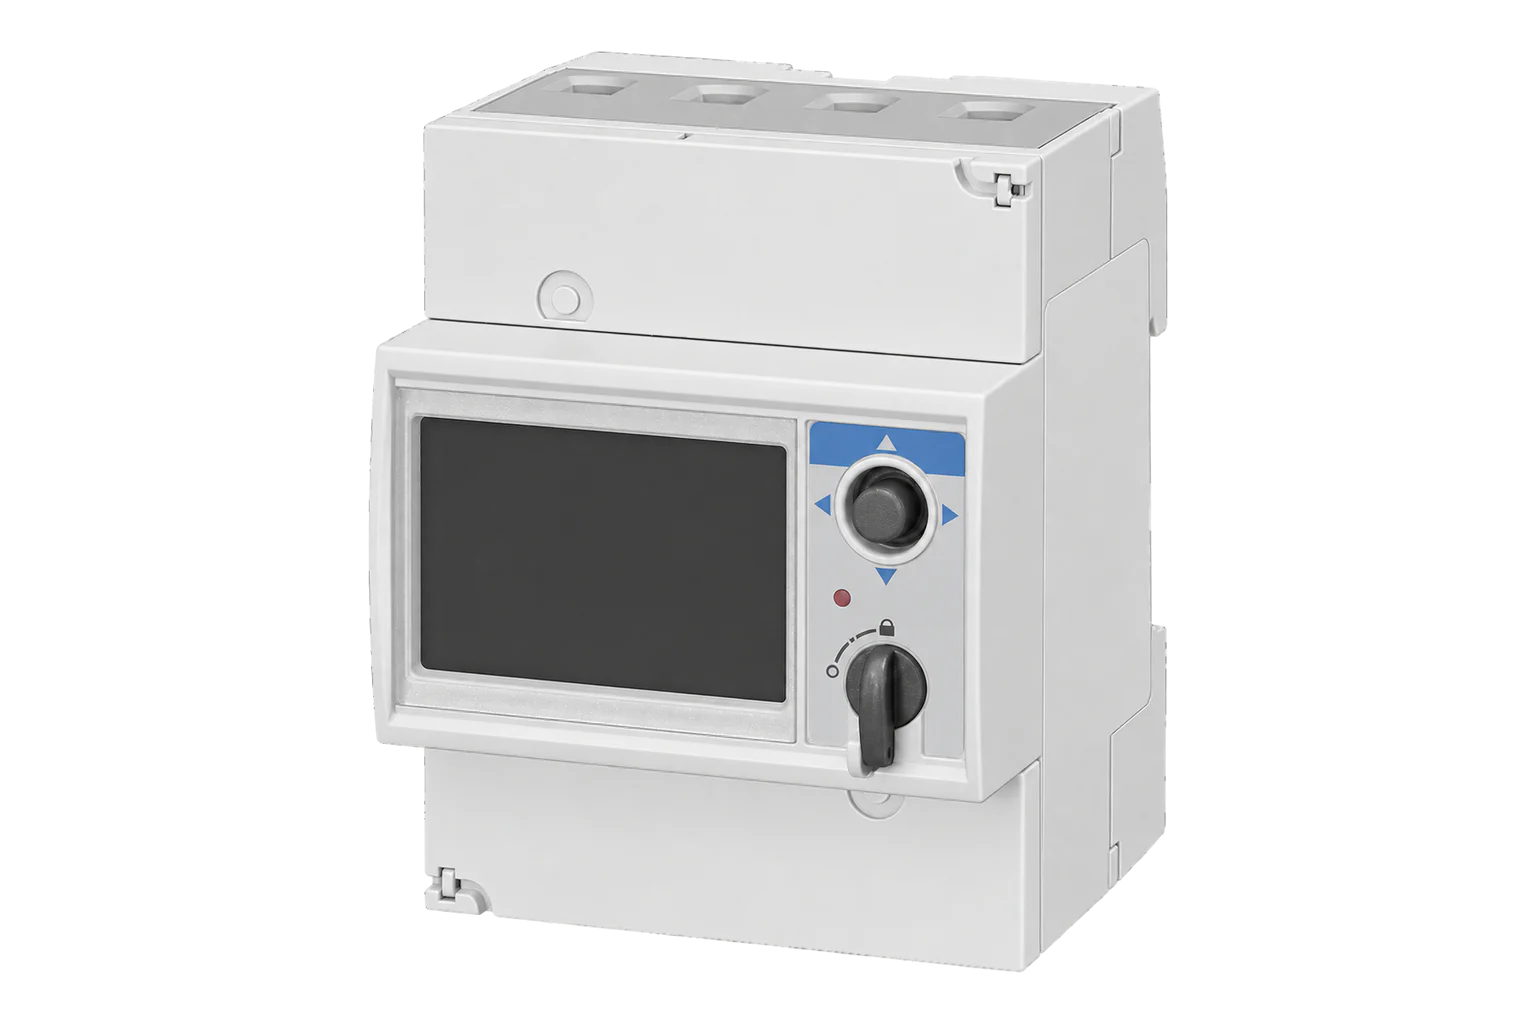
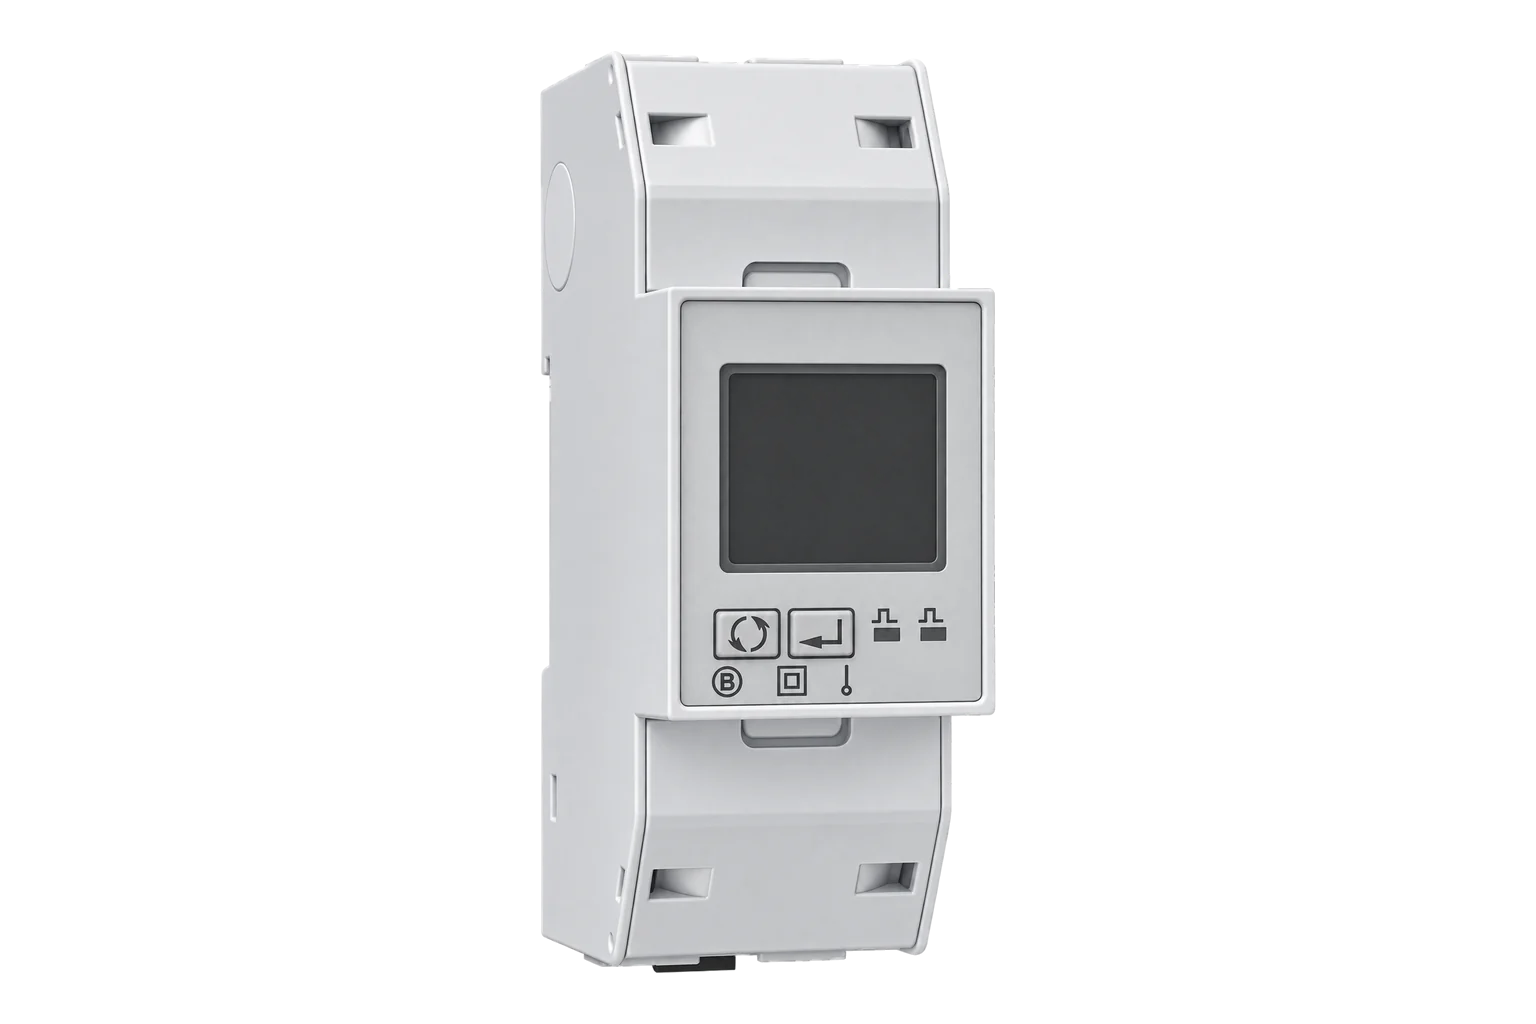
More in the Device Directory: Energy meters (62), Current transformers (7), Pulse counters and I/O (6)
Design one remote site before scaling the fleet
An engineer can define the point register, hardware, data path, failure checks and operating ownership for the pilot, then turn that evidence into a repeatable rollout.