
Compressed air energy monitoring
Measure compressor electricity alongside delivered air and header pressure, then compare complete operating periods before deciding what to investigate.
- Measure
- Compressor and dryer electricity, delivered air flow, header pressure, loaded and unloaded state
- Calculate
- Live specific power in kW/(m³/min), and period specific energy in kilowatt-hours per cubic metre
- Sensors
- ZIO-20, for each flow or pressure transmitter's 4-20 mA output Analogue Signal Sensor datasheet
- On site
- ZGW-20 Gateway, for compressor power monitoring and local calculations Gateway datasheet
Choose the question before choosing the ratio
Compressed air monitoring starts with a physical boundary and an operating question. Name every electrical supply inside that boundary, define where delivered air crosses it, and record the flow reference condition and delivery pressure. A live power-to-flow ratio helps operators see the present condition; a period result needs complete, aligned energy and volume records. Neither result diagnoses leakage or promises a saving on its own.
| Live operating view | Complete-period view | |
|---|---|---|
| Inputs | Current electrical power, reference flow and header pressure | Electrical energy and delivered reference volume over identical start and end times |
| Answers | How much power is being used per unit of present flow | How much electrical energy was used per unit of delivered air |
| Do not infer | A single reading is not annual efficiency | Overnight consumption is not automatically leakage |
Hardware for a compressed air measurement
Meter every non-overlapping electrical supply inside the declared boundary. Acquire each third-party flow or pressure transmitter on its own interface channel, and qualify controller data separately against the exact model, firmware and register map.
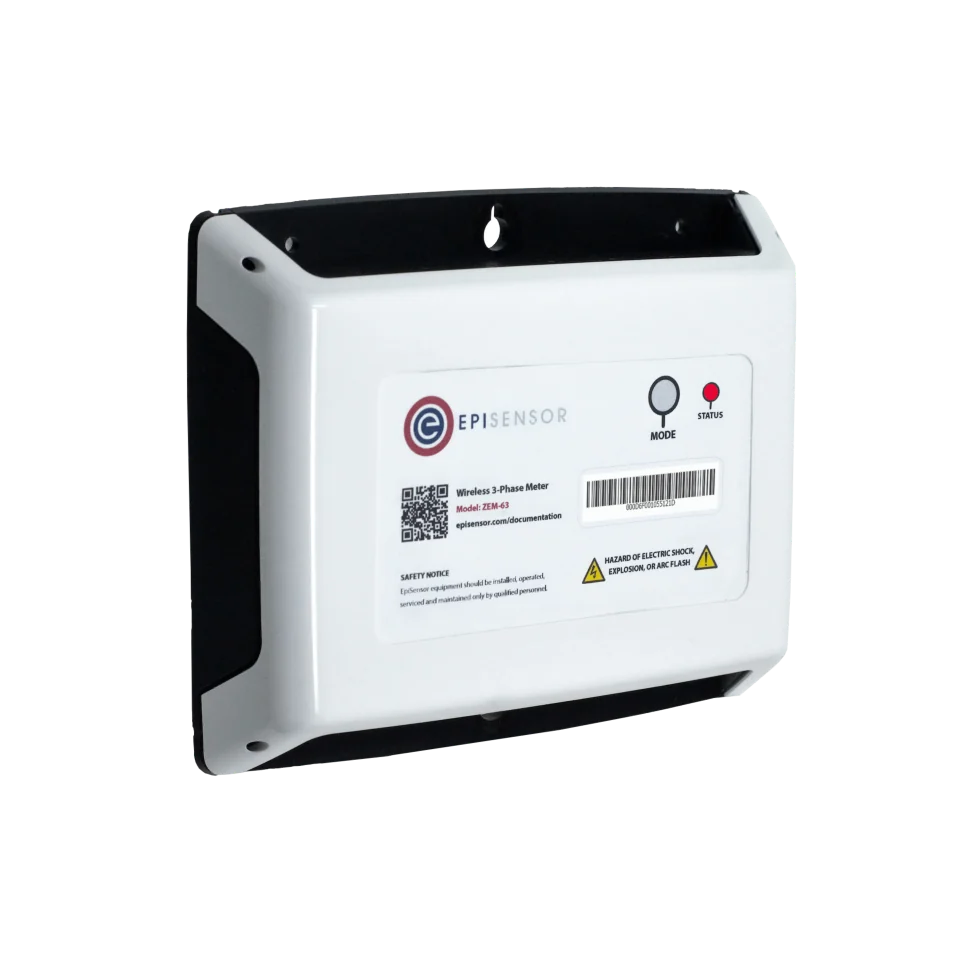
The compressor, and the dryer and auxiliaries when they are inside the boundary
1 per supply three-phase, 3 or 4 wire
- Choose the CT rating per supply: 120 A split-core, or 300 A, 1 kA and 3 kA Rogowski coils
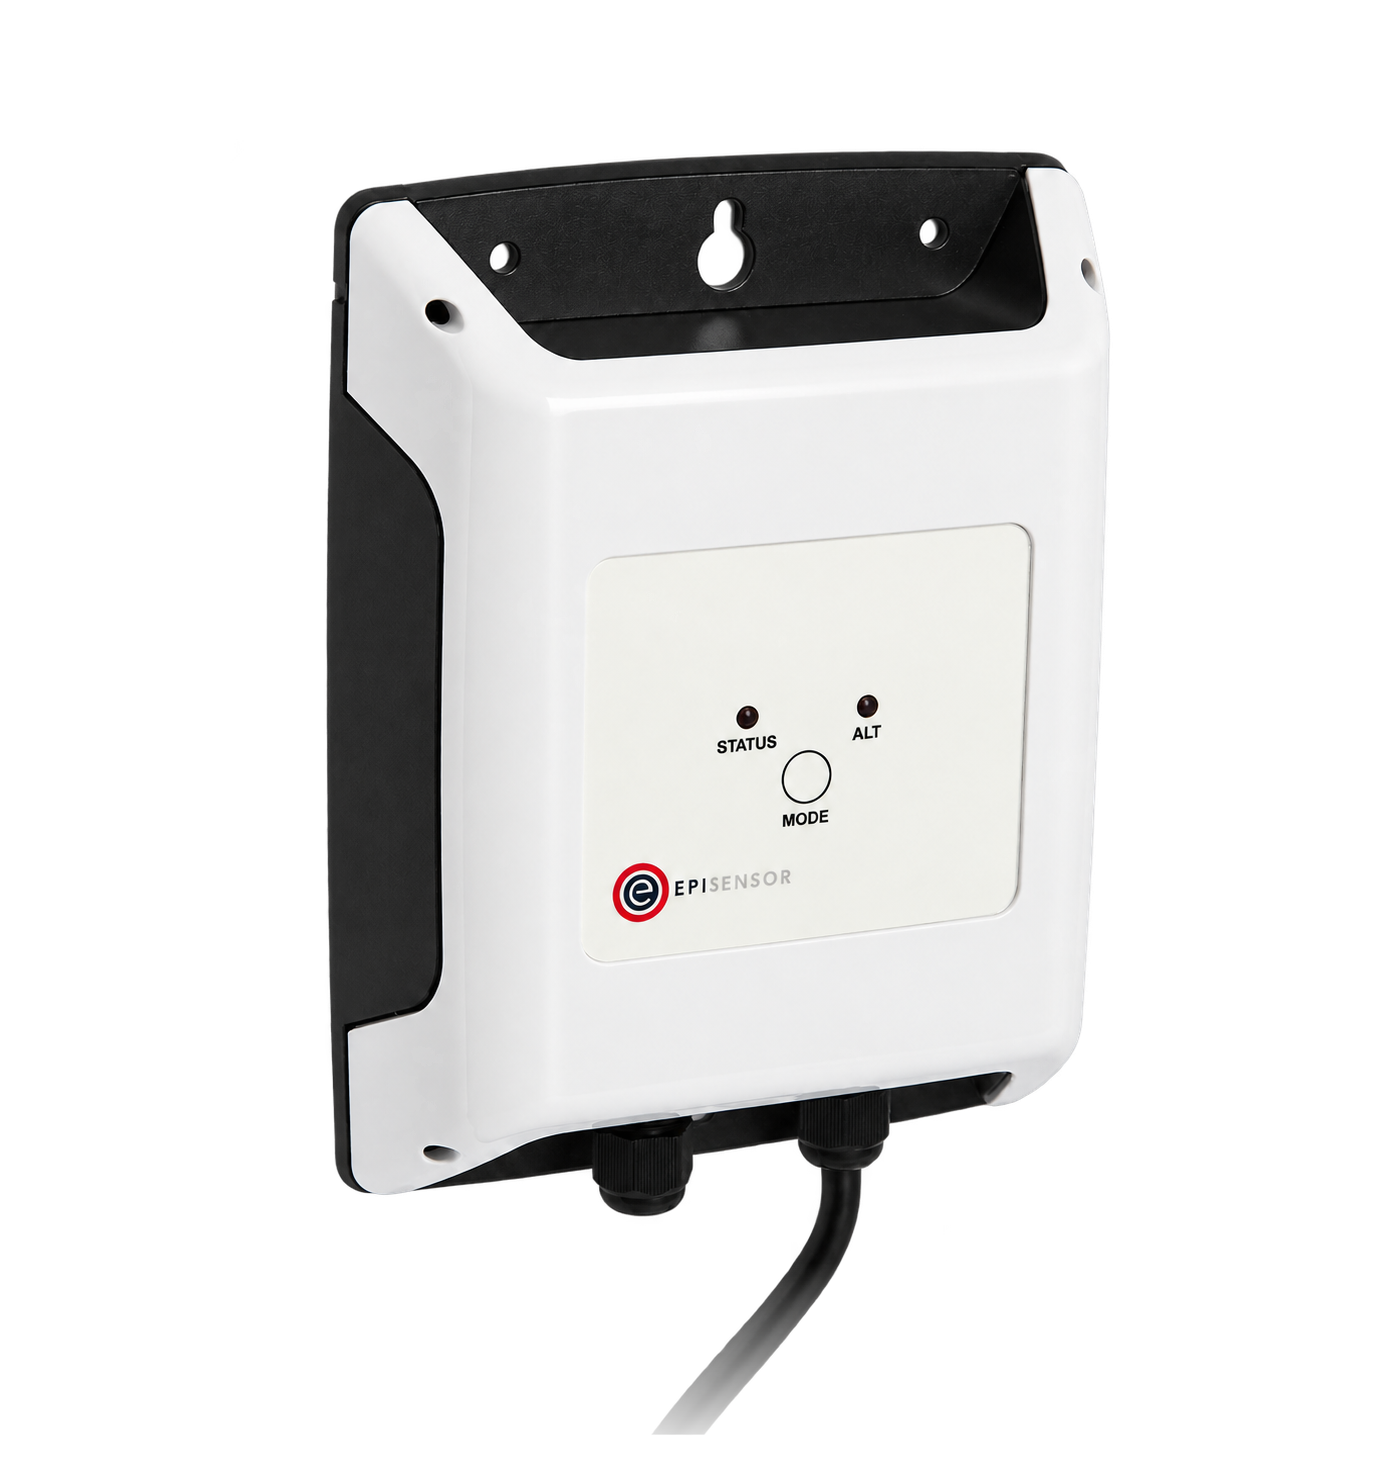
A third-party flow or pressure transmitter with an externally powered 4-20 mA output
1 per signal use two for separate flow and pressure loops
0 to 20 mA at 0.001 mA resolution, up to 36 V DC, mains powered
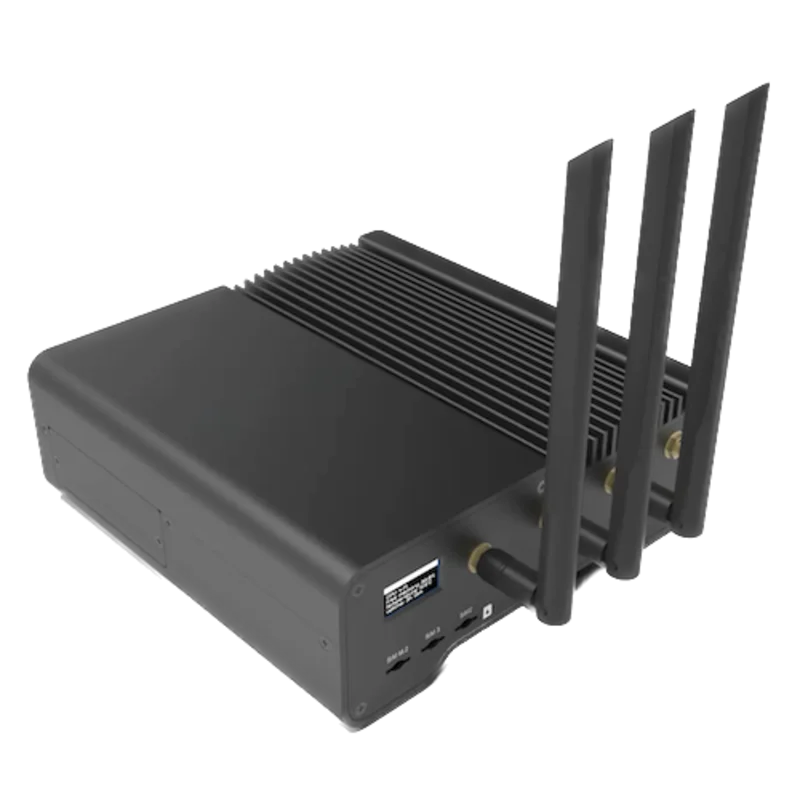
Keeps the power, flow, pressure and optional state records together and evaluates configured calculations locally
Start with 1 per compressor area, then survey device count, building layout and radio coverage commissioned on site
If the controller has a published register map
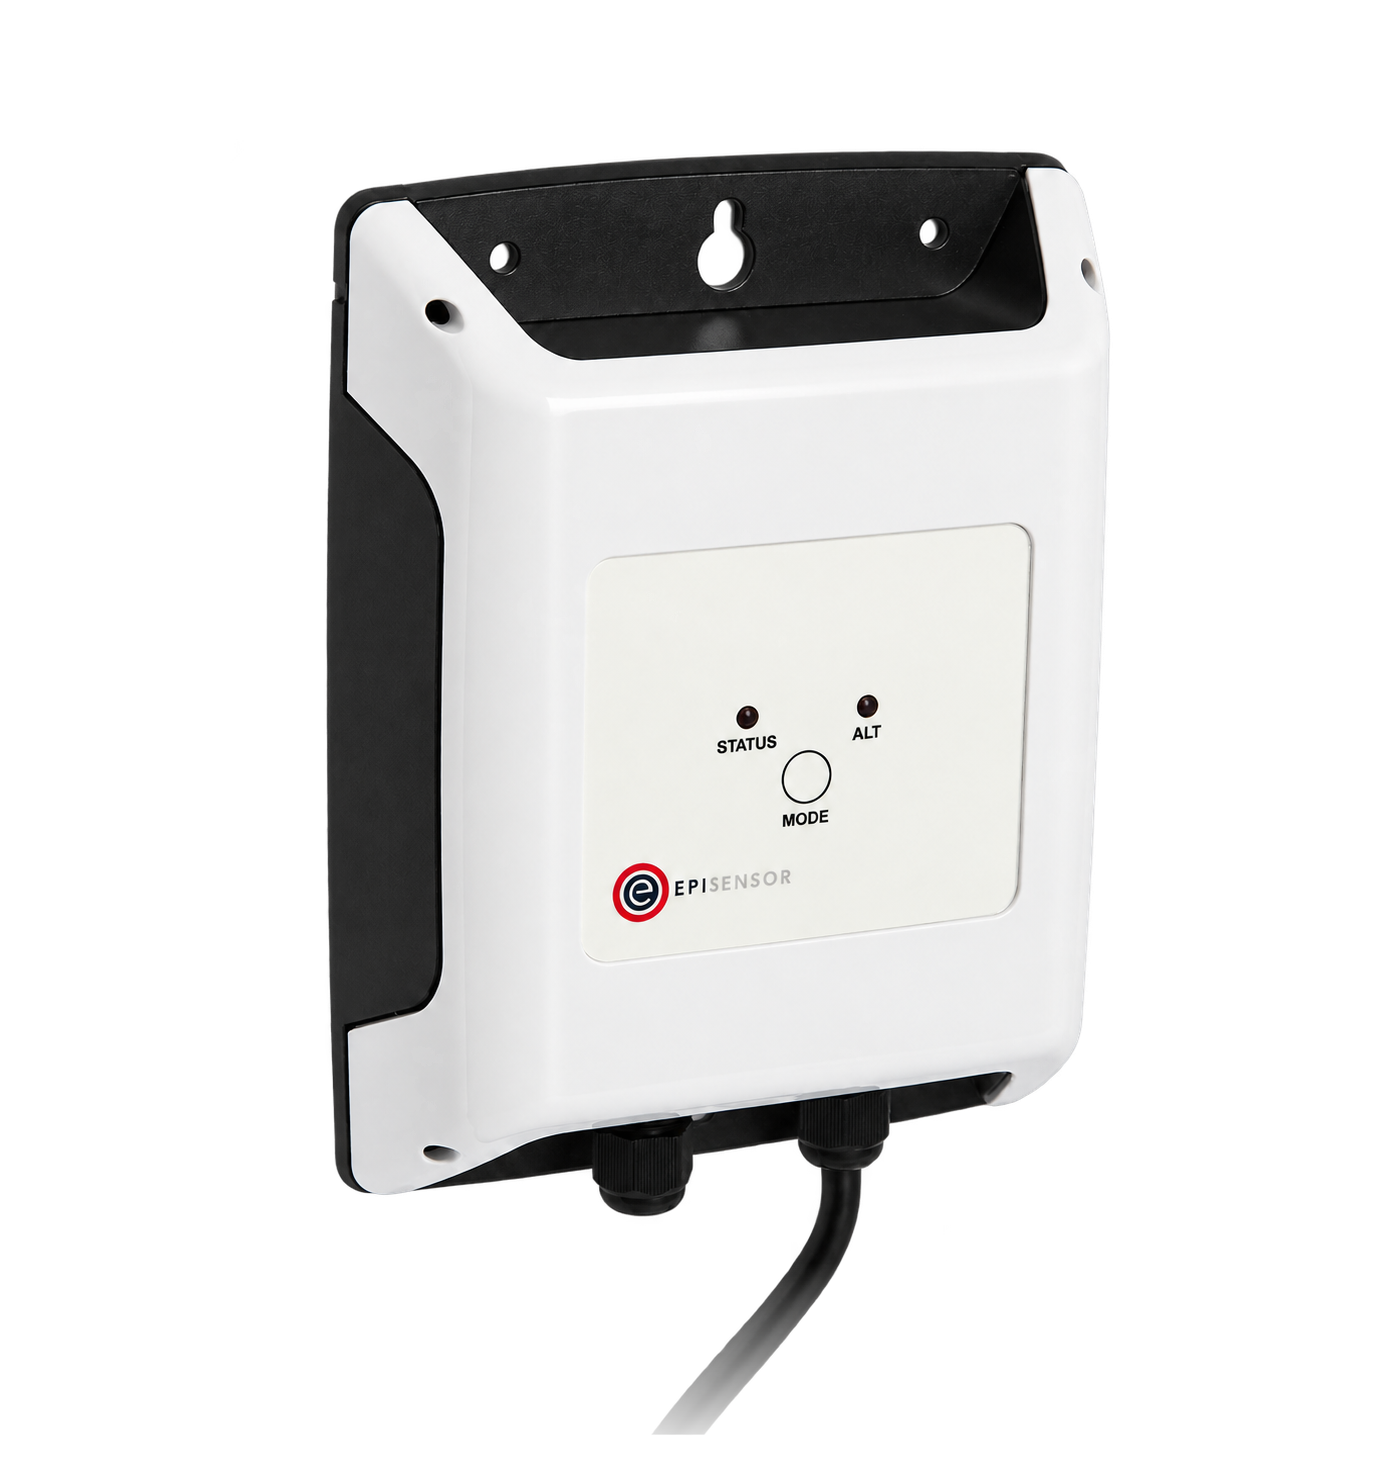
Loaded, unloaded and sequence state from the compressor controller
1 per controller up to 30 registers
Measure one declared compressor-house boundary
Electrical input and delivered flow must cover the same physical boundary and time period. Flow needs a stated reference condition; pressure needs the controlled delivery point and band. Optional controller state adds context but does not replace either measured input.
From compressor-house measurements to a comparable result
Electrical supplies and third-party process transmitters follow distinct acquisition paths before Edge keeps the named records together and evaluates configured calculations.
- Wired
- Zigbee
- Edge
- Platforms
| Position | What it tells you | Reference | Sensor |
|---|---|---|---|
| Included electricity | The energy or power drawn by the compressors, dryer and auxiliaries named inside the boundary | Use separate, non-overlapping supplies and keep the same included loads in every comparison | ZEM-65 (on this page) |
| Delivered flow | The air crossing the declared delivery boundary | Record whether the transmitter reports actual, standard, normal or free-air-delivery volume and preserve its reference temperature and pressure DOE | ZIO-20 (on this page) |
| Header pressure | The service condition at which the air was delivered and the control band the plant maintained | Acquire a separate transmitter at the controlled delivery header and keep the range, not only an average DOE | ZIO-20 (on this page), second interface |
| Optional controller state | When an identified compressor reports loaded, unloaded, stopped or sequenced operation | Use only documented registers for the exact controller model and firmware, on a bus whose master ownership and addressing are known Modbus Interface datasheet | ZMB-31 (on this page) |
State the reference conditions. Standard, normal, free air delivery and actual conditions give different cubic metres. Two figures in the same unit are not comparable until the reference matches.
Say what is inside the boundary. Dryers, drains, cooling fans and a standby compressor each move the ratio. List them with the result.
Check overnight flow before calling it a leak. Intended users, dryer purge, drains and receiver storage can all contribute. Establish operating context before labelling an overnight baseload as a leak.
How to calculate compressed air specific power and period energy
Use current power and flow for a live operating ratio. Use complete electrical-energy and delivered-volume changes over identical start and end times for a period result. Never average instantaneous ratios to construct the period figure.
live specific power = Ptotal ÷ Qref
period specific energy = ΔEtotal ÷ ΔVref
Ptotal or ΔEtotal = compressors + dryer + included auxiliaries- Ptotal
- current electrical power inside the boundary, kW
- Qref
- current delivered flow at the stated reference condition, m³/min
- ΔEtotal
- electrical energy used inside the boundary over the complete period, kWh
- ΔVref
- delivered air volume over the same complete period and reference basis, m³
Worked example
Two compressors draw 75 kW and the included dryer and auxiliary loads draw 4 kW while reference flow is 11.5 m³/min. Live specific power is 79 ÷ 11.5 = 6.87 kW/(m³/min). If those rates remained constant for eight complete hours, energy would be 632 kWh and delivered volume would be 5,520 m³, giving 0.114 kilowatt-hours per cubic metre. That second result is illustrative: actual reporting must use matched totals or qualified integration, not the constant-rate assumption.
In Edge
A live Edge calculation can sum the selected power inputs and divide by the current reference flow. The inputs can carry different timestamps, so define a stale-input policy, reject zero or near-zero flow, and inspect the result timestamp because a previous displayed result can remain after evaluation is suppressed. Work period specific energy from complete aligned energy and volume records, resolving gaps, counter resets, restarts and receiver-storage changes before division.
Commissioning checks
Prove the physical boundary, each acquired signal and one complete calculation before using the ratio to compare operation.
-
Every included supply is metered
List the compressors, dryers and auxiliaries inside the boundary and find each one's meter.
Pass when the list and the meters agree, no upstream feeder overlaps a submeter, and every excluded load is written down.
-
Flow identity and reference basis are recorded
Record the transmitter model, gas configuration, range, units, low-flow validity and reference temperature and pressure from its display or manual, then compare them with Edge.
Pass when both ends agree, including whether the value is actual, standard, normal or free-air-delivery flow.
-
Analogue scaling and failure behaviour are proved
Use agreed reference points to compare each 4-20 mA loop with the transmitter indication, then check below-range, above-range and interrupted-loop behaviour in an approved test environment.
Pass when flow and pressure values stay within the agreed tolerance and an invalid signal never becomes a believable process value.
-
Pressure is measured where it is controlled
Compare the transmitter with an independent gauge at the controlled header under steady and changing demand.
Pass when the two agree, and the trend shows the control band rather than one average.
-
Electrical inputs agree with the installation
Confirm voltage phase assignment, CT phase assignment, CT direction and selected ordering option against a known operating condition and the applicable installation documentation.
Pass when each included supply has the expected sign and magnitude, and the summed boundary has no duplicate or missing feeder.
-
Any controller states are model-specific
Confirm the exact controller model, firmware, bus ownership, address, data types and scaling, then observe an available load or unload cycle against the plant.
Pass when each published state used for context agrees with the observed machine and unknown codes remain unknown.
-
Missing and near-zero flow withhold the live result
In an approved test environment, make one required input stale and separately exercise zero or near-zero flow, then inspect the result value and timestamp before and after recovery.
Pass when evaluation is suppressed or clearly invalid, no missing value becomes zero, and any retained result is identifiable by its older timestamp.
-
One complete period is reconciled by hand
Take matching start and end energy and volume records, check gaps and resets, note the pressure band and receiver or storage condition, then divide the deltas manually.
Pass when the hand result matches the period calculation for the same boundary, reference basis and exact timestamps.
-
Any onward record preserves meaning
At the receiving platform, compare the asset identity, boundary, value, unit, reference basis, source timestamp and freshness state with Edge.
Pass when the receiving record matches; successful transport alone is not accepted as semantic verification.
Limits of this measurement
The two ratios describe a declared operating point or period. They do not diagnose the system or approve a control change.
- Flow at different reference conditions is not comparable, even when the units look the same.
- Specific power or period specific energy does not by itself quantify leakage, useful production, air quality, dryer purge or receiver and storage behaviour.
- Controller state and a power signature do not allocate delivered air to one compressor when receivers or other machines serve the same header.
- A pressure reduction is a system decision that needs a competent compressed-air assessment and the equipment's own limits.
- Monitoring does not replace pressure-system safety controls, certified instruments or the transmitter manufacturer's installation requirements.
Sources
- Improving compressed air system performance, a sourcebook for industry (opens in a new tab) US Department of Energy and the Compressed Air Challenge
- ISO 11011:2013, Compressed air: Energy efficiency assessment (opens in a new tab) (opens in a new tab) International Organization for Standardization
- Air compressor performance verification and testing results (opens in a new tab) (opens in a new tab) Compressed Air & Gas Institute
- Wireless 3-Phase Electricity Monitor datasheet (opens in a new tab) EpiSensor. Specifications, ranges and ordering codes.
Related
- OverviewEnergy monitoring
- Calculator4-20 mA loop voltage calculator
- GuideEquipment performance monitoring boundaries
- GuideEnergy monitoring project worksheet


Third-party devices for this application
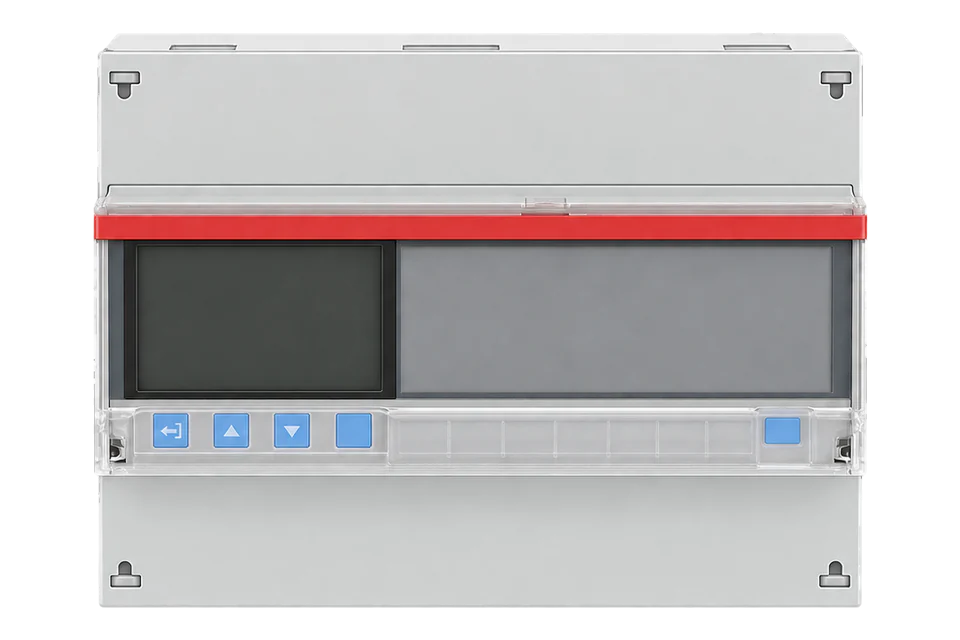
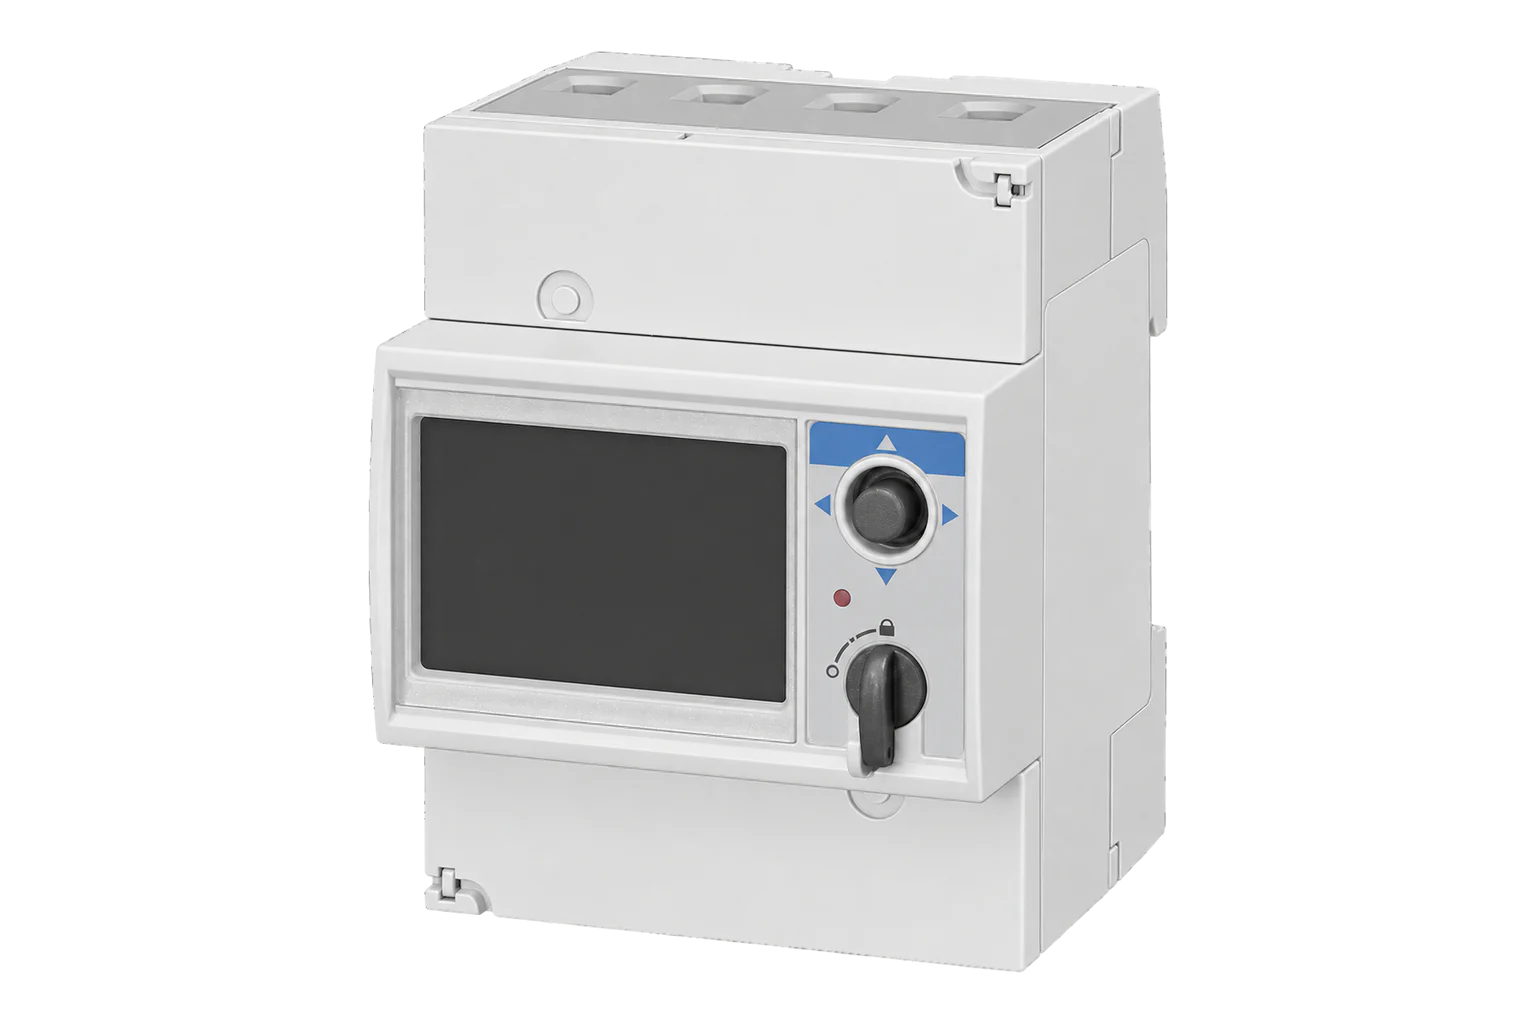
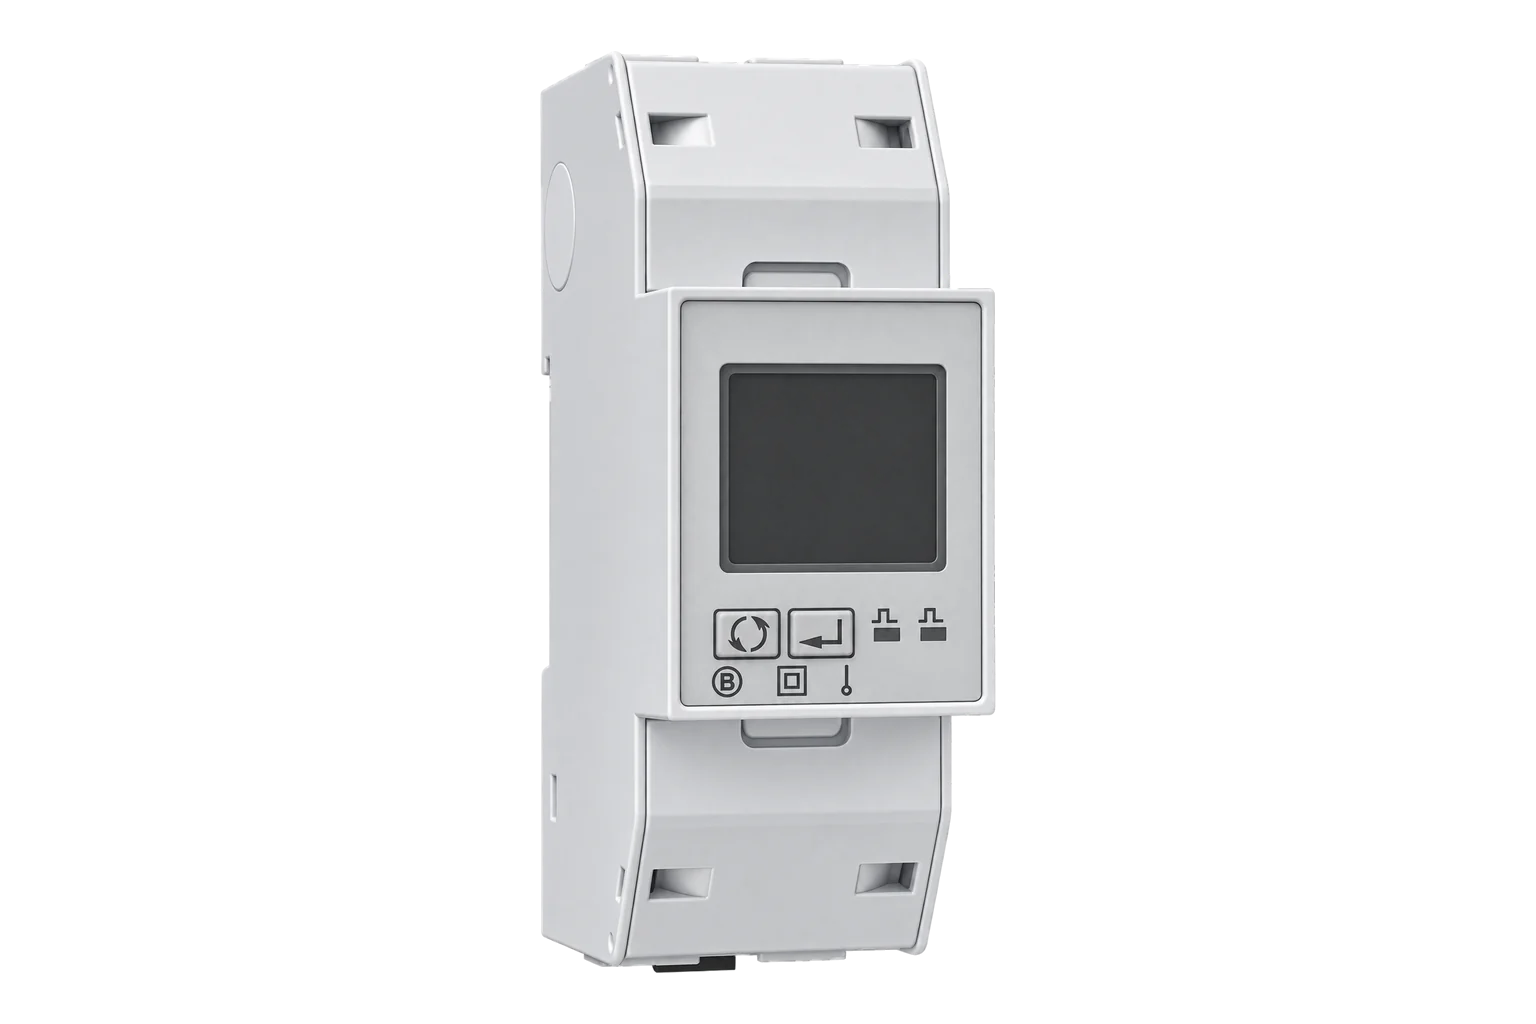
More in the Device Directory: Energy meters (62), Current transformers (7)
Bring the supplies, transmitters and operating question
An engineer can agree the boundary, qualify the flow and pressure signals, review any controller map, and size the electricity meters for a first compressor area.