Boiler performance monitoring
A pulse counter on the fuel meter coming in, a heat meter on the way out, and the firing state that tells you which periods are worth comparing.
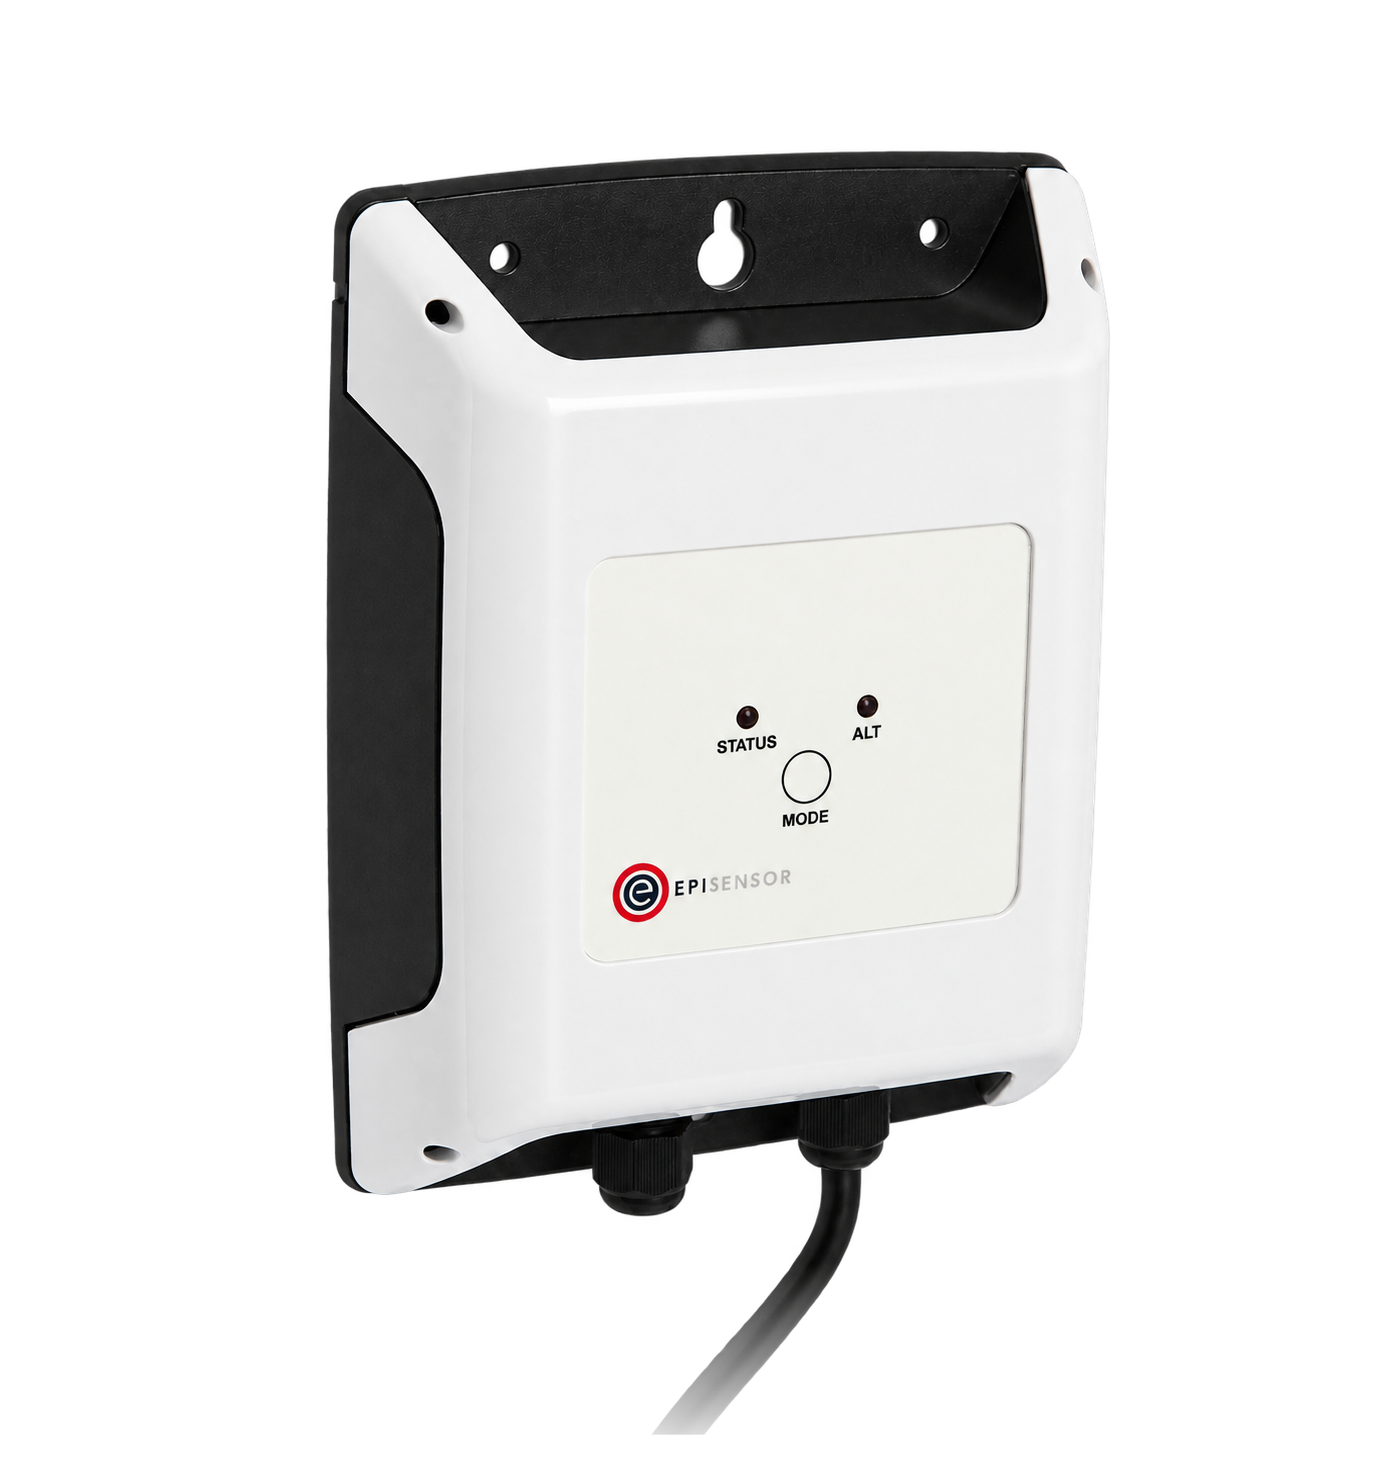
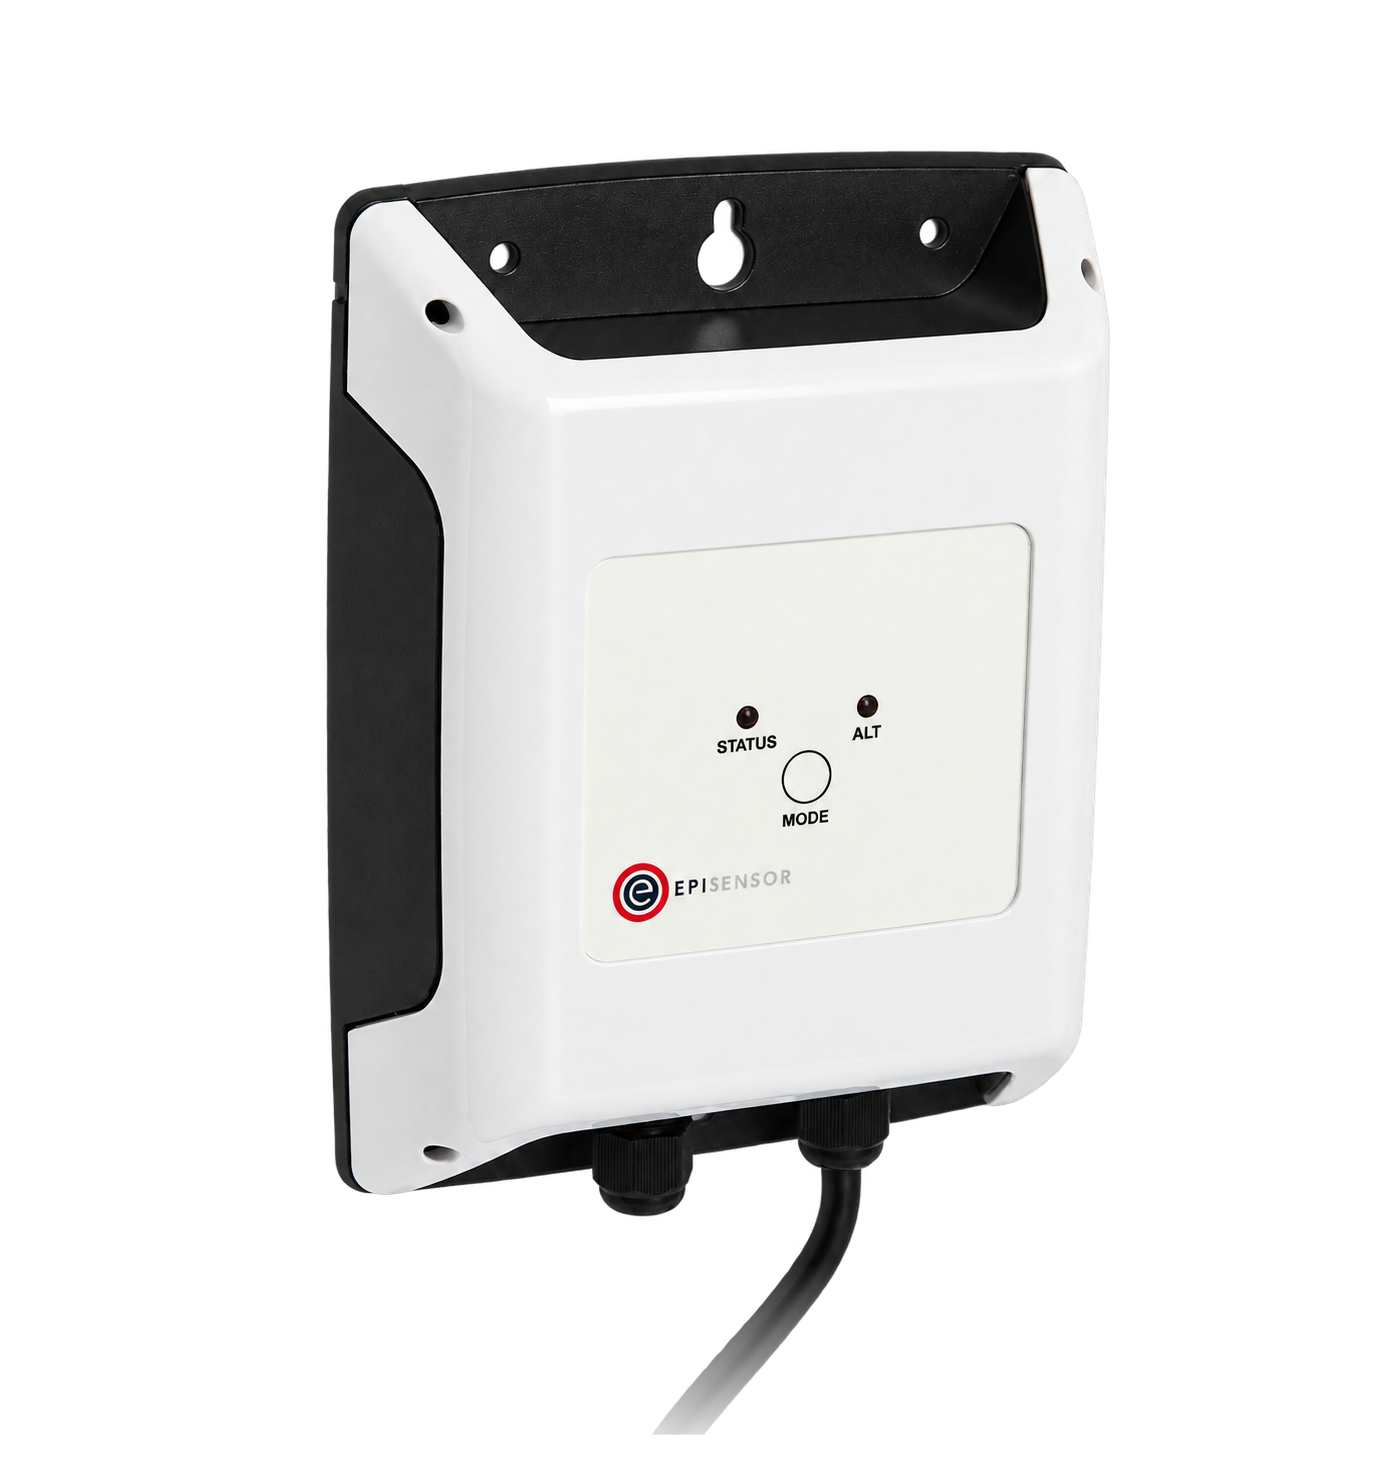
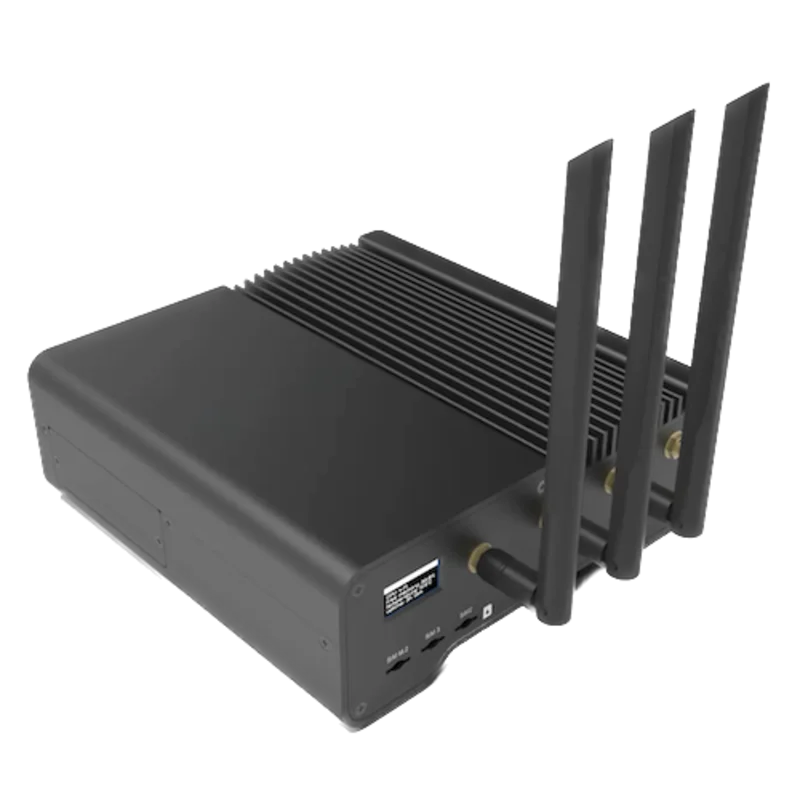
- Measure
- Fuel or electrical input, delivered heat, flow and return temperature, firing state
- Calculate
- Boiler energy monitoring by firing state: heat out against energy in, over the same period
- Sensors
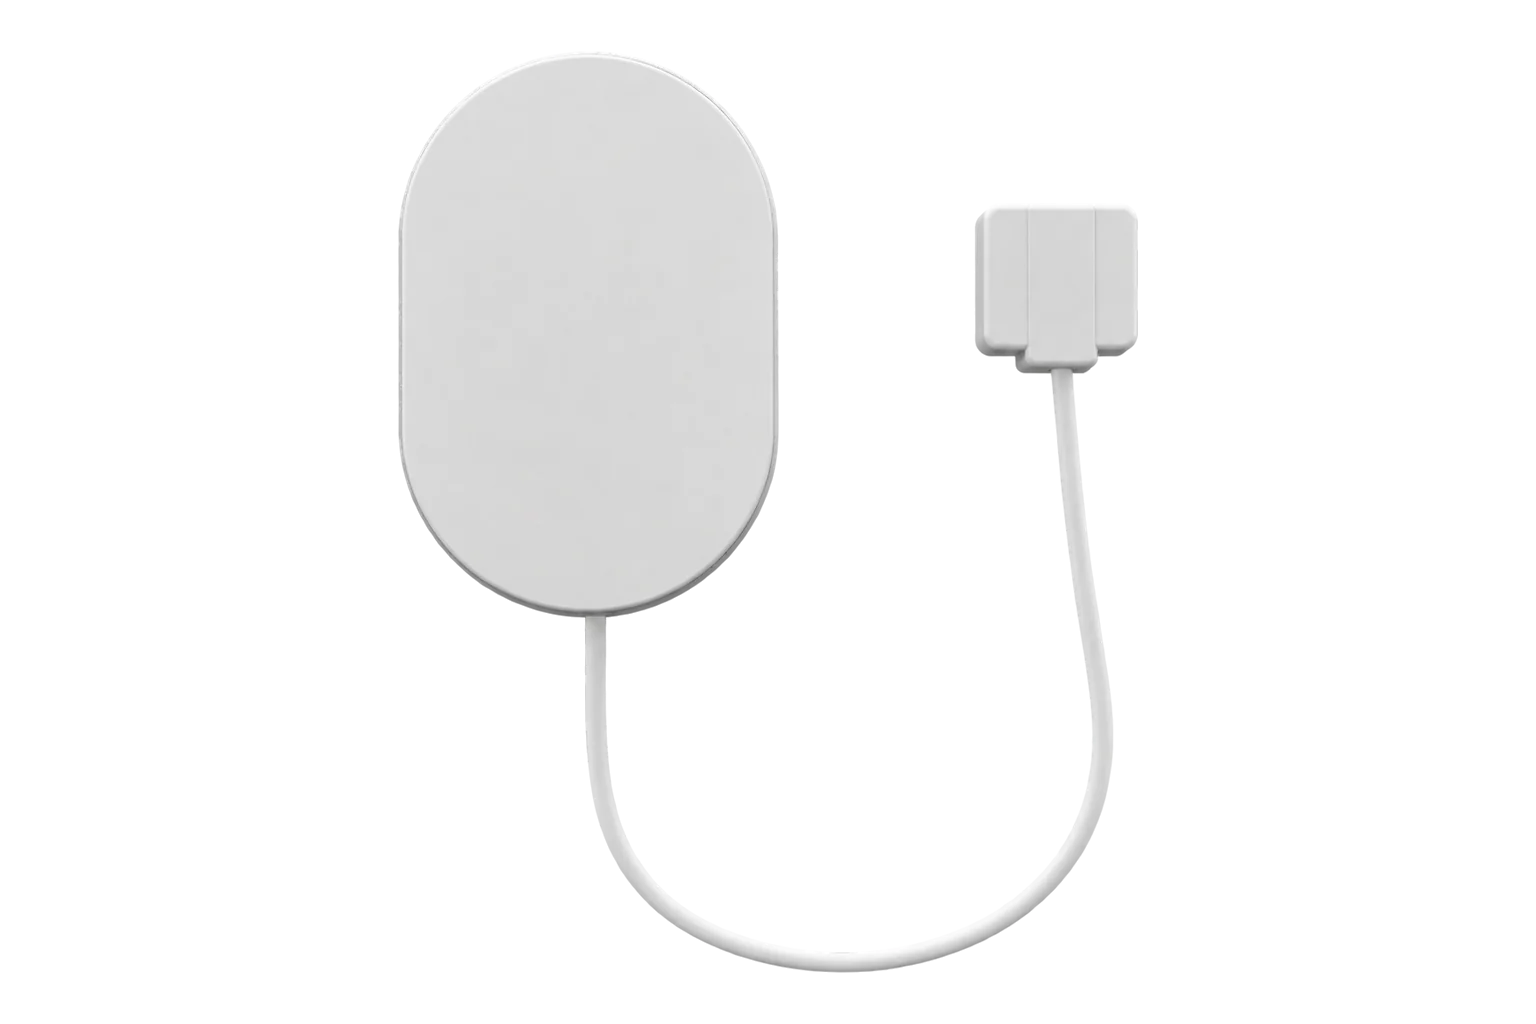
- ZPC-20, counts the gas meter's pulses, up to 40 Hz Pulse Counter datasheet
- On site
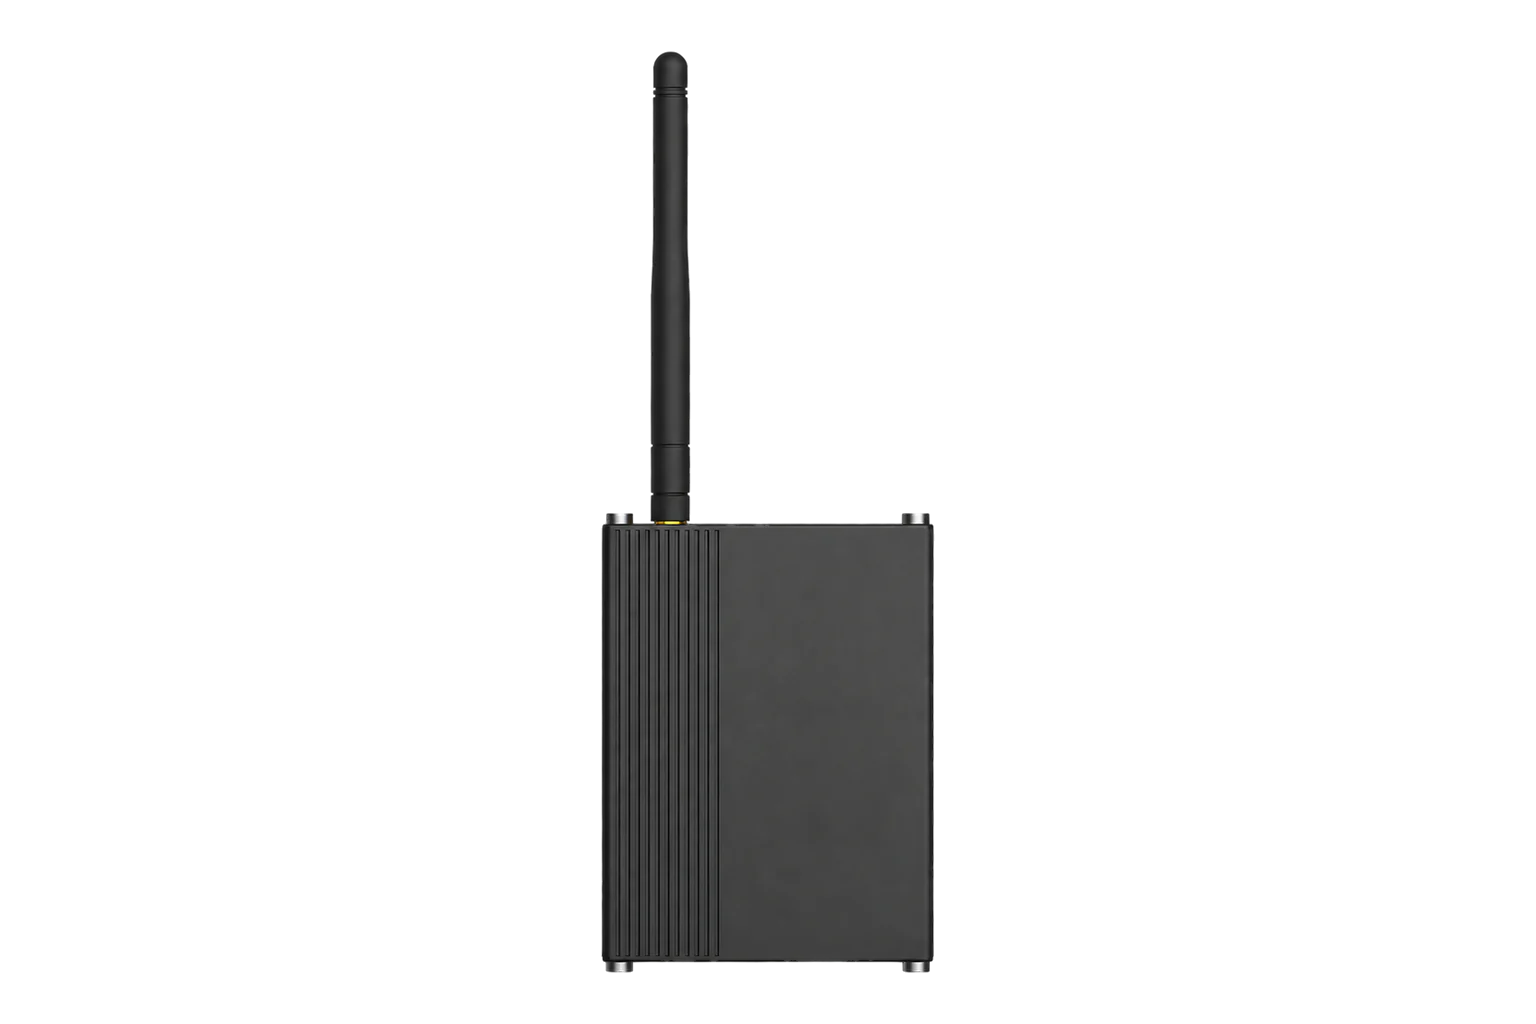
- ZGW-20 Gateway, keeps the input, the output and the state together Gateway datasheet
Hardware for a boiler efficiency measurement
One meter for fuel quantity used to calculate input energy, one for the heat coming out, and a way to tell when the burner was firing.
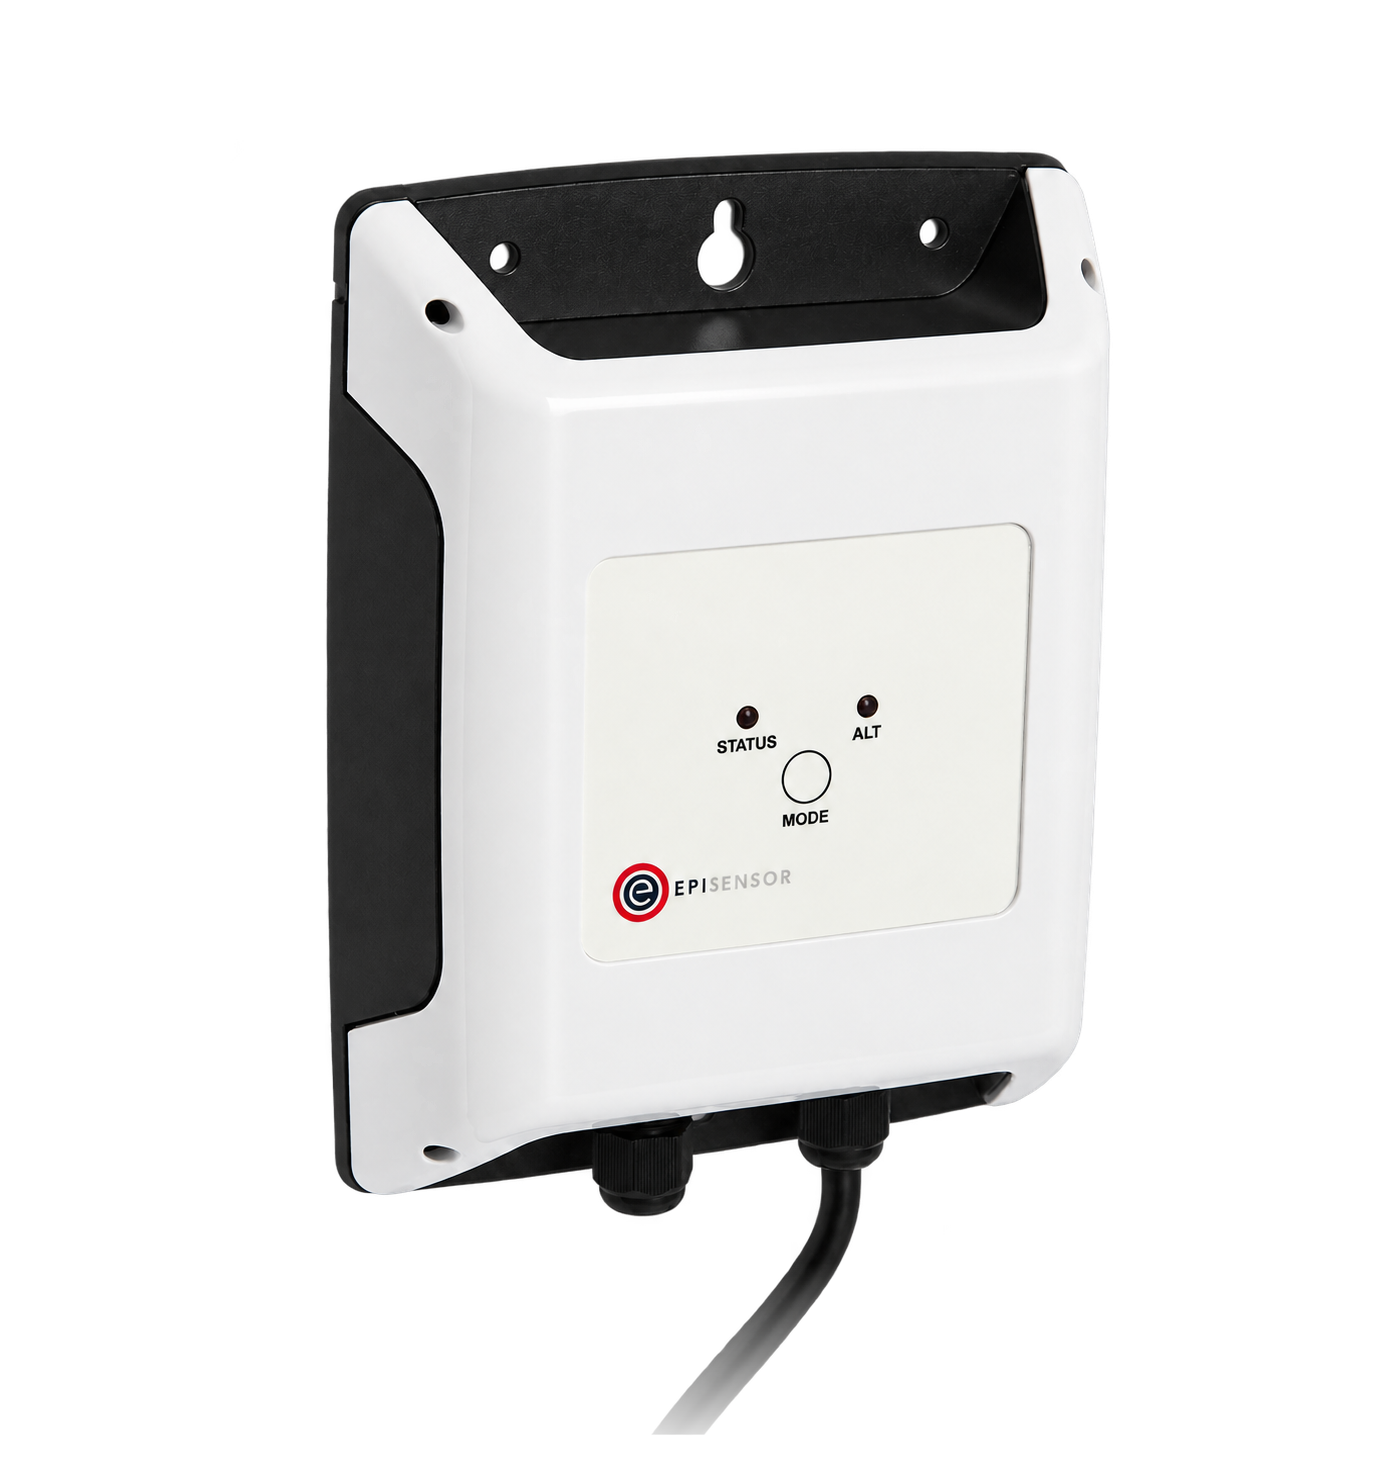
The gas or oil meter's pulse output measures fuel quantity used to calculate input energy
1 per meter two channels on the ZPC-22
Pulses down to 10 ms wide, up to 40 Hz, inputs to 35 V DC, mains powered
Heat meter on the boiler circuit: flow, matched temperatures and delivered energy
1 per meter one connected meter each
Reads the meter's own energy, volume and temperature records
Holds the input, the output and the state, and calculates the ratio by state
1 per site up to 250 wireless devices
If the circuit has no heat meter
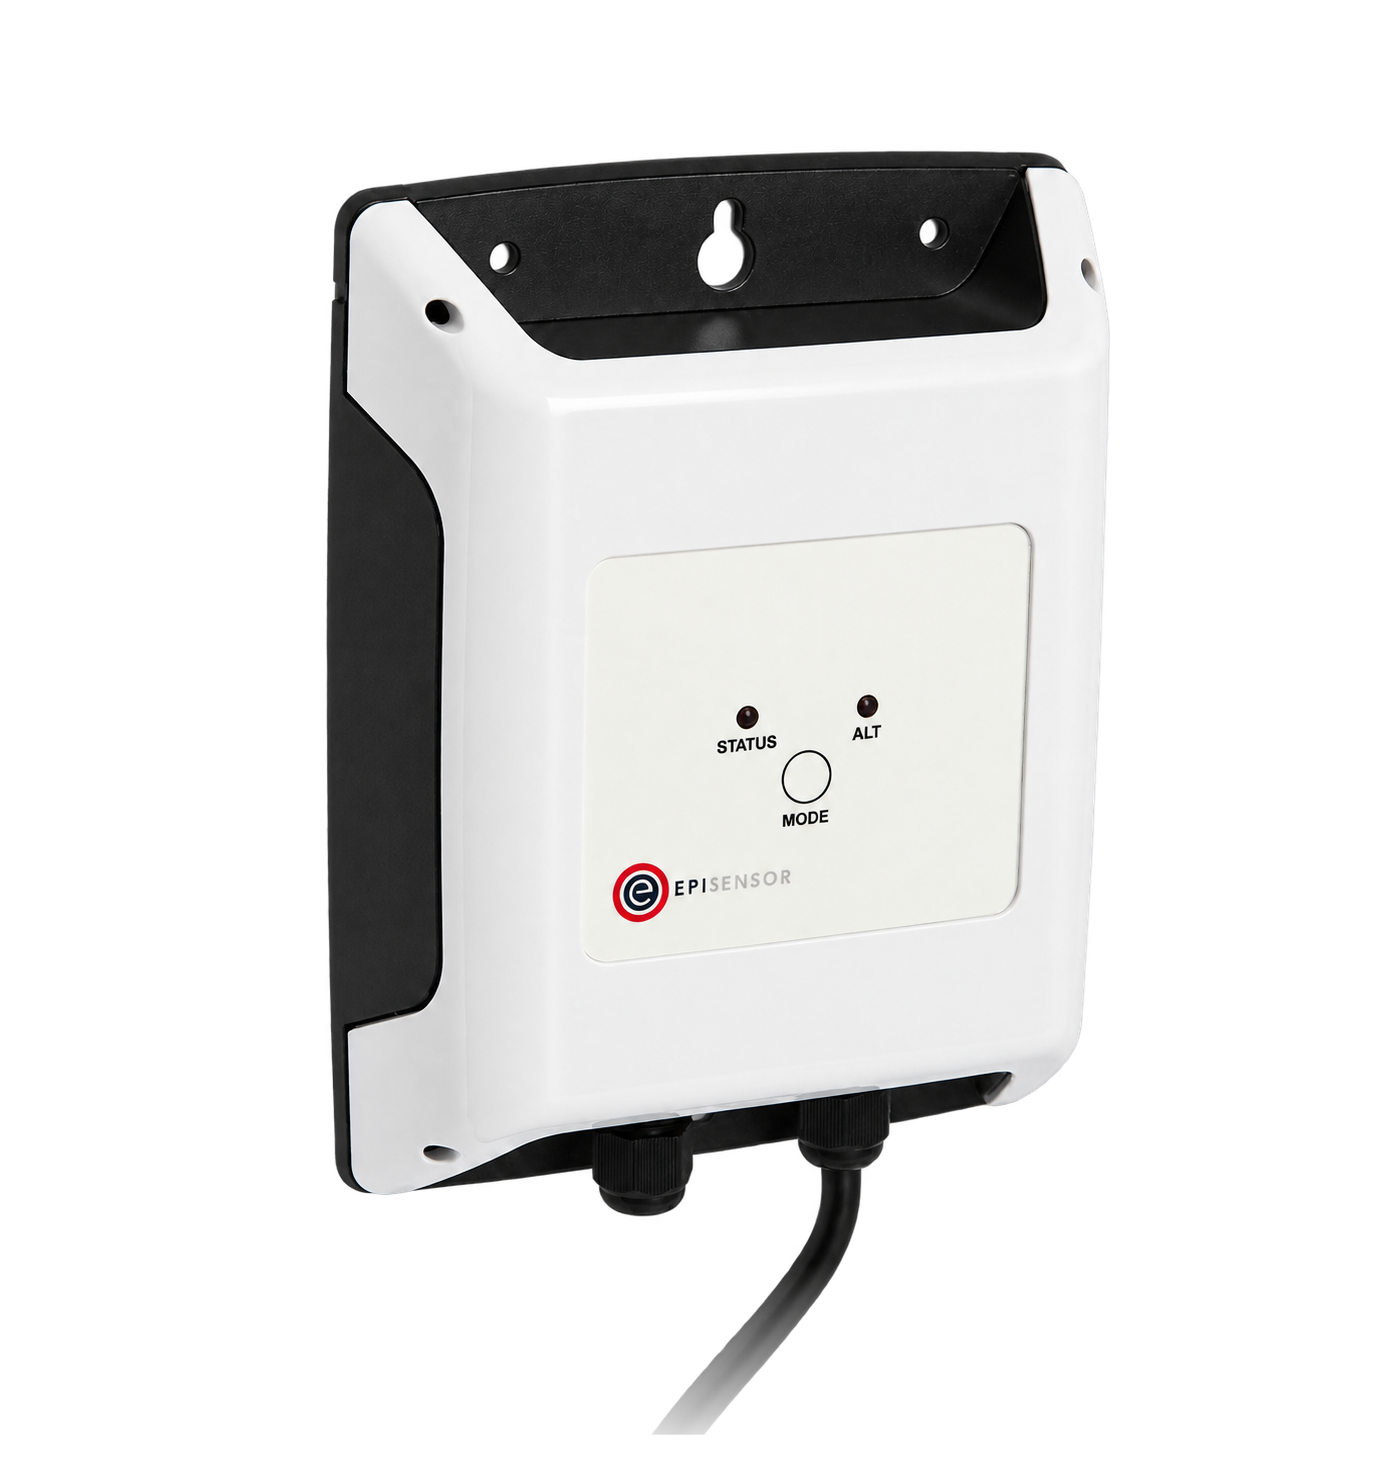
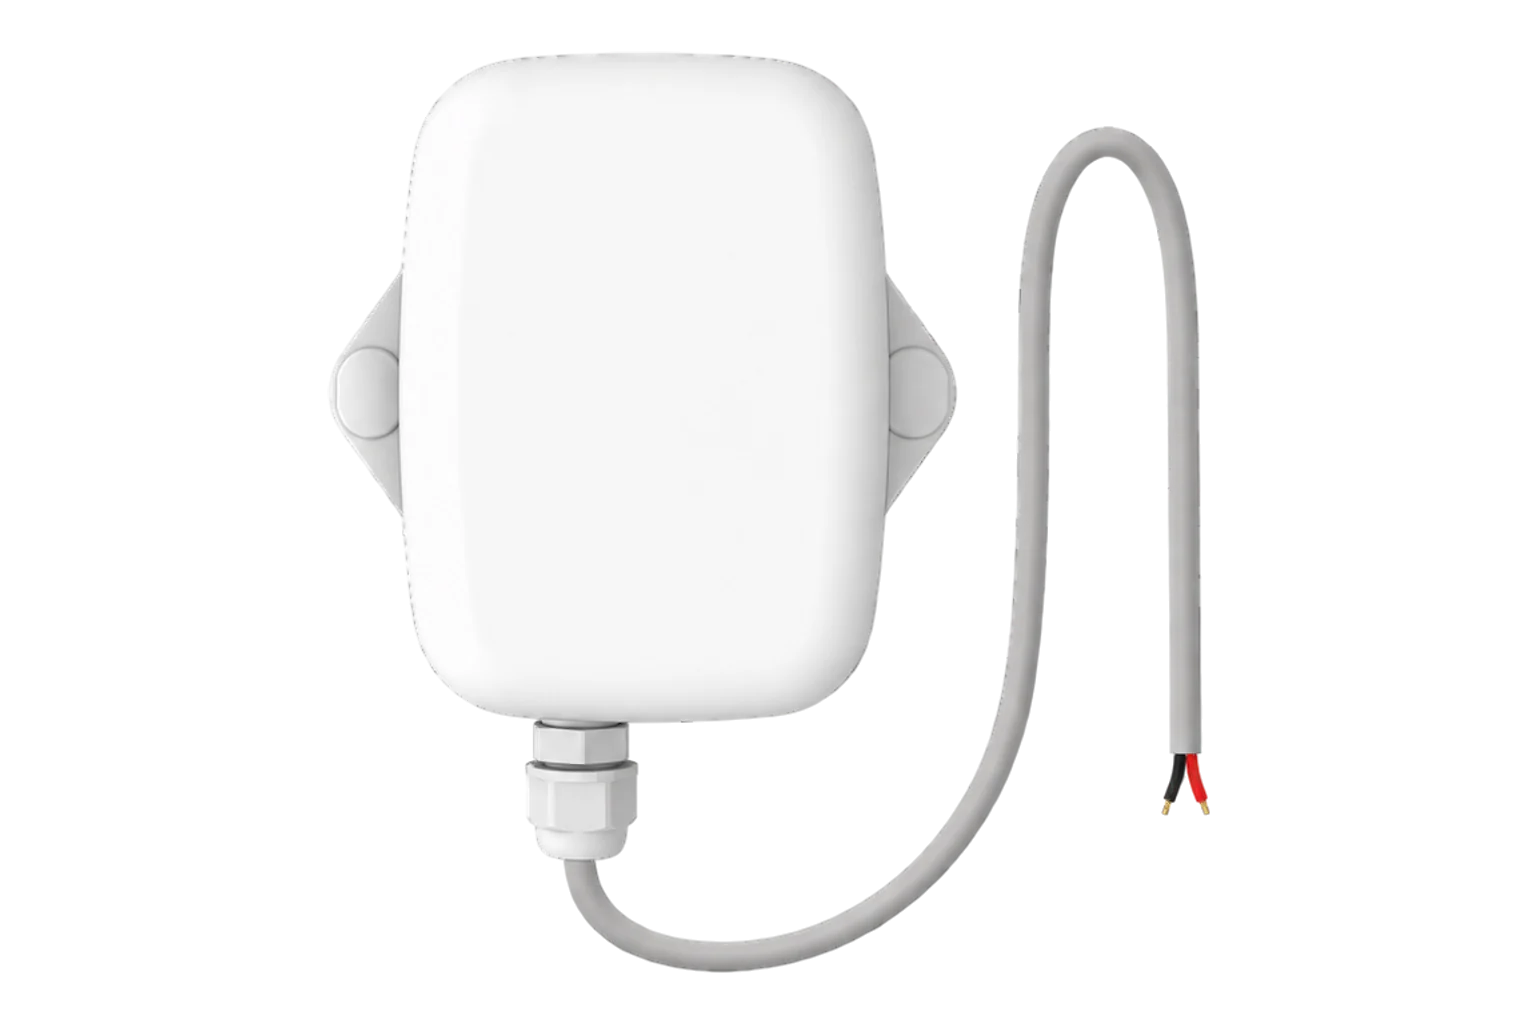
Flow and return temperature where there is no heat meter to read them from
1 per boiler flow and return
 2 steel pipe probes, 2 m leads
±0.2 °C from 0 to 70 °C, ±0.5 °C from −40 to 105 °C, 2 m leads
If the controller has a published register map
Firing state, stage, setpoint and lockout from the burner or plant controller
1 per controller up to 30 registers
Input, output and the state between them
A ratio needs both sides on the same clock, and a state that says whether the two periods being compared were doing the same job.
From field measurement to Edge
Each field signal reaches its named EpiSensor interface, reports through the site Gateway and is handled locally in Edge.
- Wired
- Zigbee
- Edge
- Platforms
| Position | What it tells you | Reference | Sensor |
|---|---|---|---|
| Fuel input | Fuel quantity entering the boundary, in the units the meter registers; calorific value converts it to energy | Record the pulse weight and whether the figure is gross or net calorific energy Pulse Counter datasheet | ZPC-20 (on this page) |
| Delivered heat | The useful energy the circuit received | The heat meter's own calculated record, from its flow sensor and matched flow-and-return temperature pair M-Bus Interface datasheet | ZHM-21 (on this page) |
| Flow and return | The temperature lift, and the operating regime the boiler ran at | A matched pair, both on the same circuit Probe Temperature Sensor datasheet | TES-22 (on this page) |
| Firing state | Which periods were firing, standby, cycling or locked out | A control command is not proof of flame or of delivered heat Modbus Interface datasheet | ZMB-31 (on this page) |
Choose gross or net calorific value once. A gas volume becomes energy through a calorific value. Write down which basis is used, and use the same one on both sides of any comparison.
Calculate steam from mass flow. A temperature difference across water does not describe steam. Mass flow and the thermodynamic state are needed, and the condensate boundary with them.
Allow ±0.5 °C above 70 °C. LTHW flow commonly runs at 70 to 82 °C, which is outside the pipe probe's ±0.2 °C band. A flow and return pair measured with surface probes on an 80 °C circuit carries that wider error on both readings, so a small lift is the case to treat with most care.
How to compare boiler input and output
Take both totals over the same interval, and quote the operating state with the result.
Efin = pulses × pulse weight × calorific value
ratio = Qout ÷ Efin- Efin
- input energy over the interval, kWh
- pulse weight
- units of gas or oil per pulse, from the meter
- calorific value
- energy per unit of fuel, from the supplier
- Qout
- delivered heat over the same interval, kWh
Worked example
A gas meter registers 1,000 pulses at 0.1 m³ per pulse over a day: 100 m³. At 10.9 kWh per m³, that is 1,090 kWh in. The heat meter rose by 905 kWh over the same day, a ratio of 0.83. It is a ratio for that day at that load, not a combustion efficiency.
In Edge
One calculated sensor converts pulses to input energy, a second divides delivered heat by it, and the firing state is kept as its own point so the periods can be separated afterwards.
Commissioning checks
Check the two meters before the ratio is discussed.
-
The pulse weight is the meter's
Read the pulse weight from the meter's own plate or manual, and compare a counted period with the meter's display.
Pass when the counted volume matches the display over a bounded period.
-
The heat meter reads as it displays
Compare energy, volume and temperatures in Edge with the meter's display at the same moment.
Pass when every value and unit matches.
-
Both sides share a clock
Compare the timestamps of the input and output readings over one interval.
Pass when the interval boundaries line up, and neither side lags by more than one interval.
-
The firing state is true
Watch the burner or its indication while the state point changes.
Pass when the state changes when the plant does, and standby is not recorded as firing.
-
The boundary is written down
List what is inside the measurement: which auxiliaries, which circuits, which fuel basis.
Pass when somebody else could reproduce the same ratio from the list.
Limits of this measurement
This is an input and output ratio at the boundary you chose. It is not a combustion measurement.
- It does not calculate or certify combustion efficiency, flue losses, emissions or burner safety.
- Steam and condensing systems need thermodynamic and condensate boundaries this arithmetic does not have.
- A calorific value from a supplier's average is not a measurement of the gas that was actually burnt.
- Boiler control, water treatment, pressure systems and statutory inspection stay with the competent specialists.
Sources
- Improve your boiler's combustion efficiency, steam tip sheet 4 (opens in a new tab) US Department of Energy, Advanced Manufacturing Office
- Benchmark the fuel cost of steam generation, steam tip sheet 15 (opens in a new tab) US Department of Energy, Advanced Manufacturing Office
- Pulse Counter datasheet (opens in a new tab) EpiSensor. Specifications, ranges and ordering codes.
Related
-
Heat pump performance monitoring
Read the heat meter over M-Bus, meter every electrical input, and compare COP over complete periods. -
Electric boiler demand response
A controller that sheds heating stages, a thermal store that says how much can be shed, and a record of what the site took back afterwards.
- OverviewEnergy monitoring
- CalculatorPulse meter scaling calculator
- GuideEquipment performance monitoring boundaries
Deployed at




Third-party devices for this application
More in the Device Directory: Temperature and humidity sensors (21), Pulse counters and I/O (6)
Work out what a boiler's existing meters can tell you
An engineer can check the pulse output, see whether the heat meter can be read as it stands, and size the kit.