Water consumption monitoring for commercial buildings
Bring main and branch water meters into Edge through a Pulse Counter, keep each meter’s units and totals, and compare like-for-like periods.
- Measure
- Commercial water monitoring at the site supply and selected high-use branches
- Good practice
- Water submetering needs matching units, timestamps and a recorded meter hierarchy before totals are compared EPA WaterSense
- Sensors
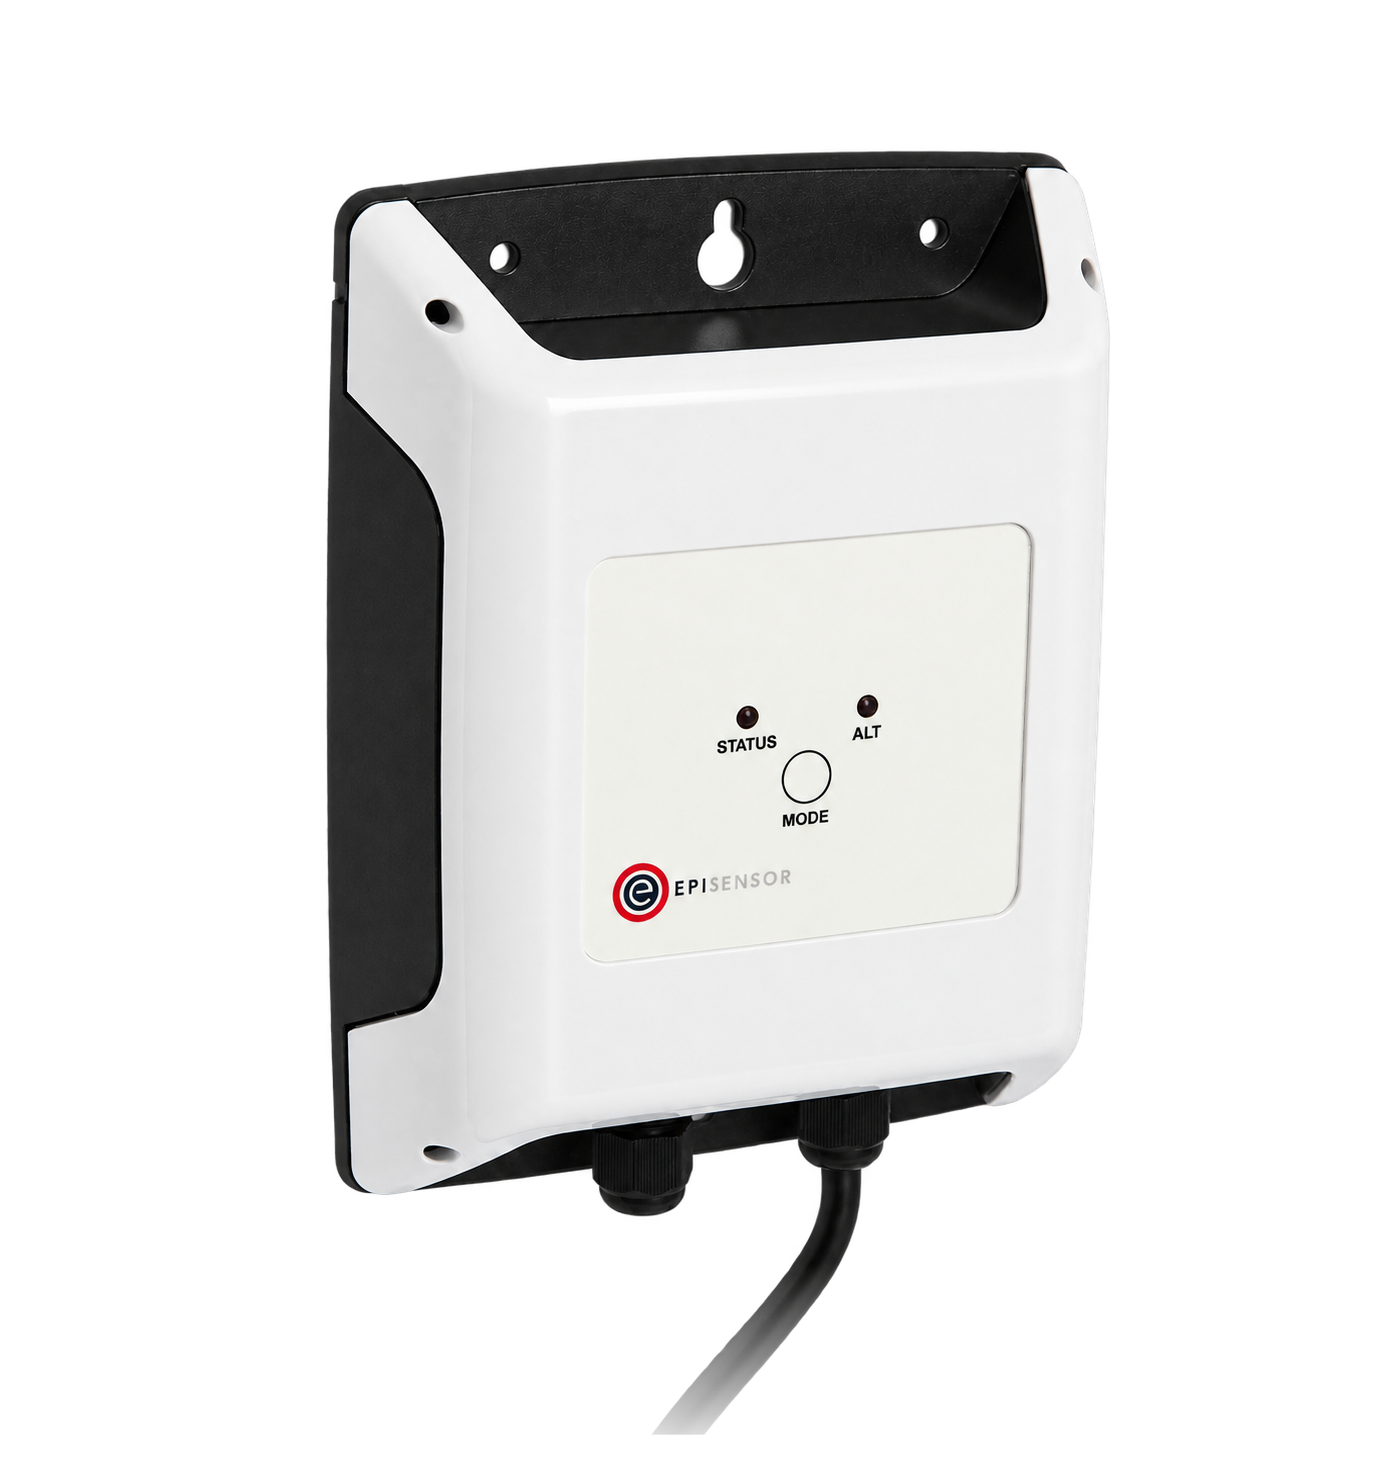
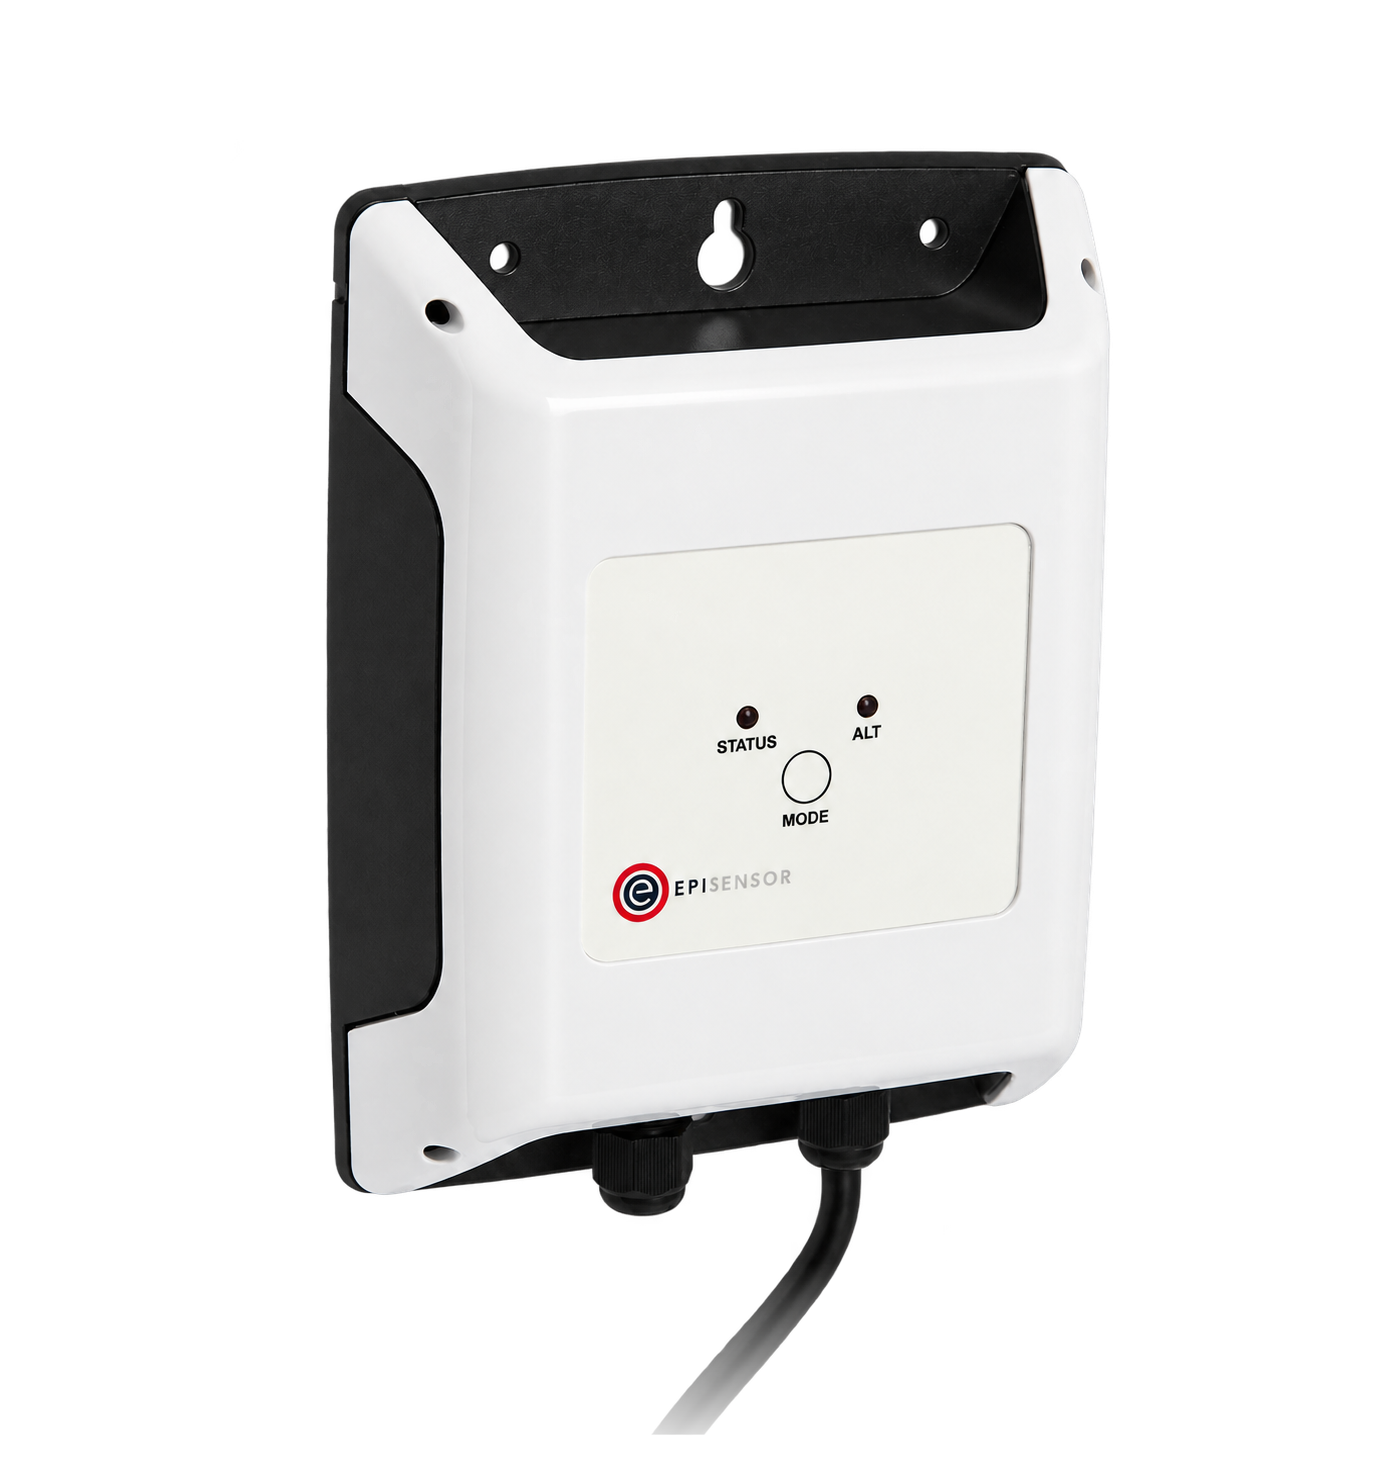
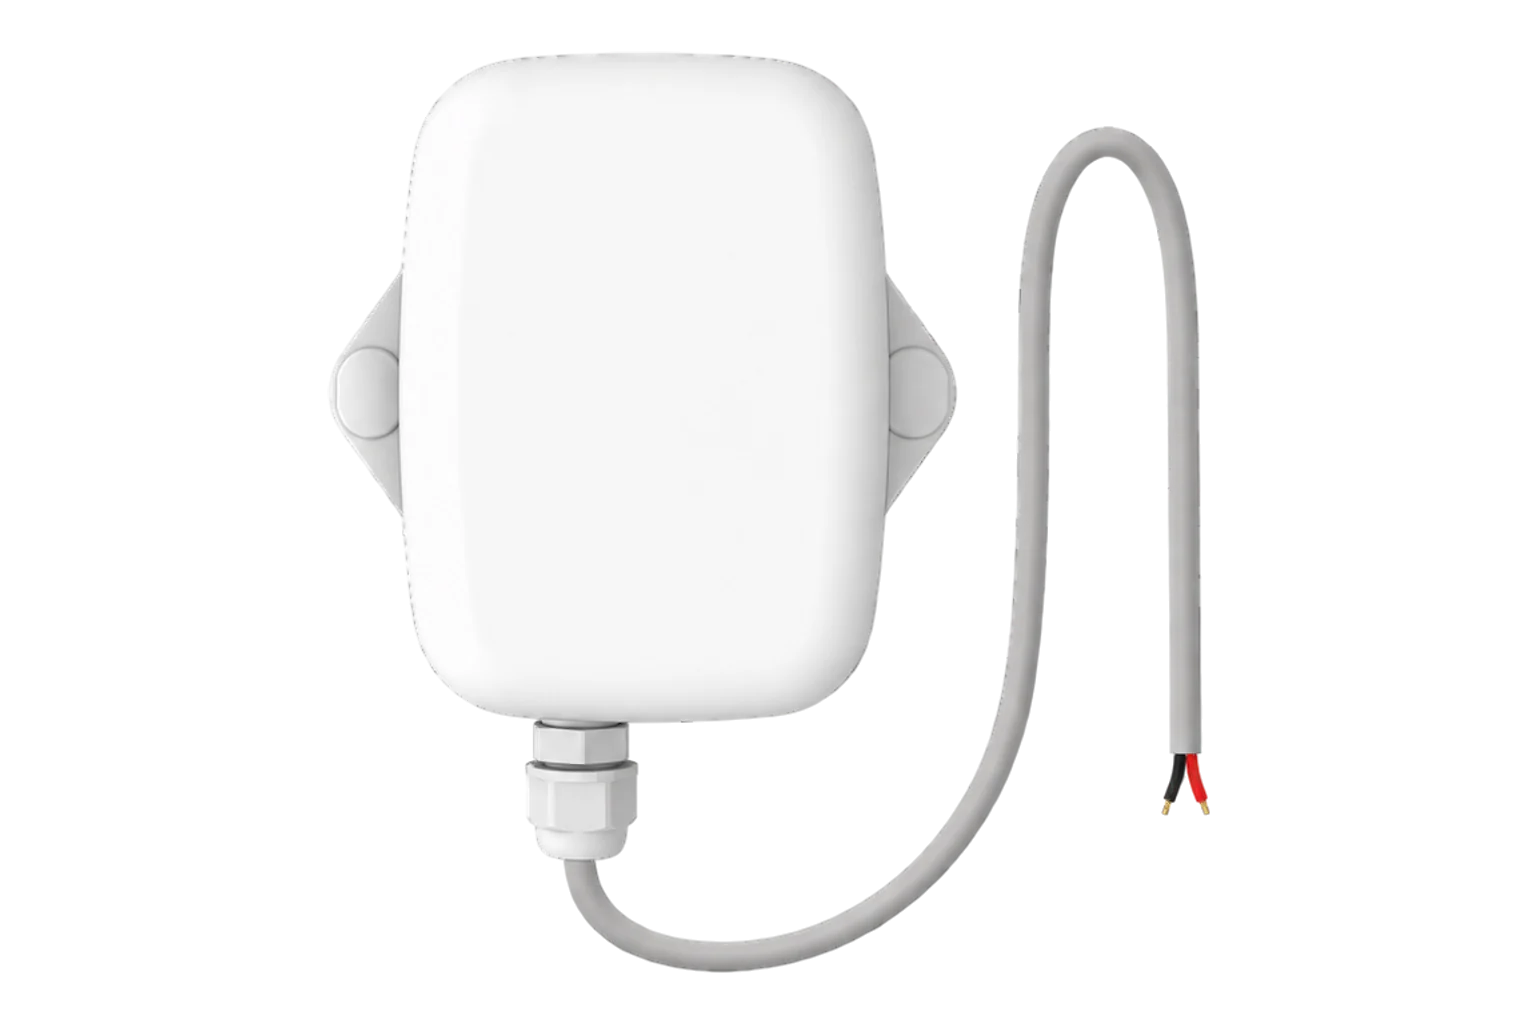
- ZPC-20, counts pulses down to 10 ms wide, up to 40 Hz, on inputs rated to 35 V DC Pulse Counter datasheet
- On site
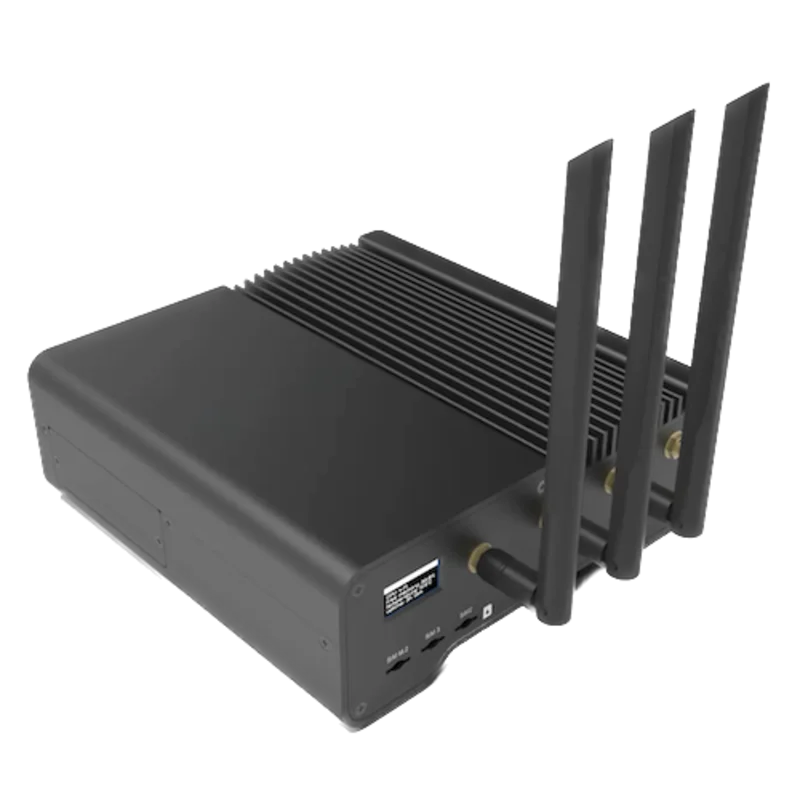
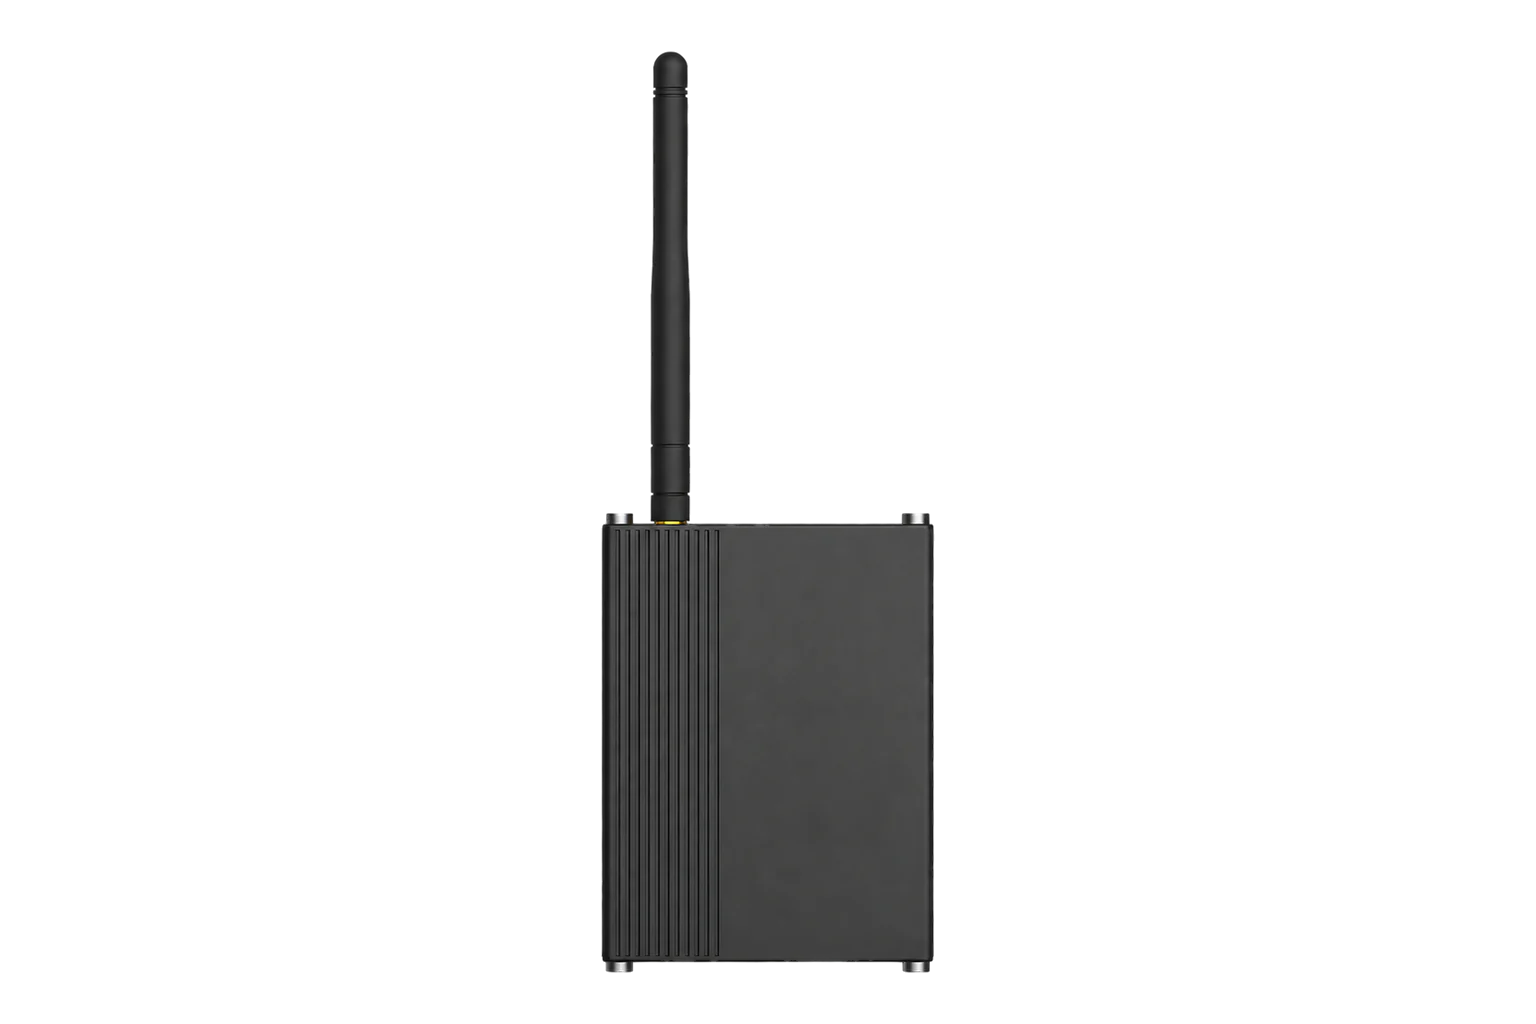
- ZGW-20 Gateway, Edge keeps the totalisers, intervals and configured local rules Gateway datasheet
Choose the water meter output before the interface
This guide assumes the site already has suitable water meters. Read the model, output type, units and scaling from each meter before selecting the EpiSensor interface. A pulse output goes to a ZPC counter. A documented Modbus RTU register map goes to a ZMB interface. EpiSensor acquires the meter's reading; it does not replace the meter, size the pipe or certify the plumbing installation.
| Existing meter output | EpiSensor route | What must be proved |
|---|---|---|
| Pulse | ZPC-20, or a battery model where its 4 Hz limit is sufficient | Output type, pulse weight, width, polarity and maximum rate |
| Modbus RTU | ZMB-31 on the documented RS-485 segment | Address, serial settings, register type, byte order, scale and units |
Hardware for commercial water consumption monitoring
Count one acquisition path per existing meter output, then add a Gateway for the surveyed wireless coverage area.
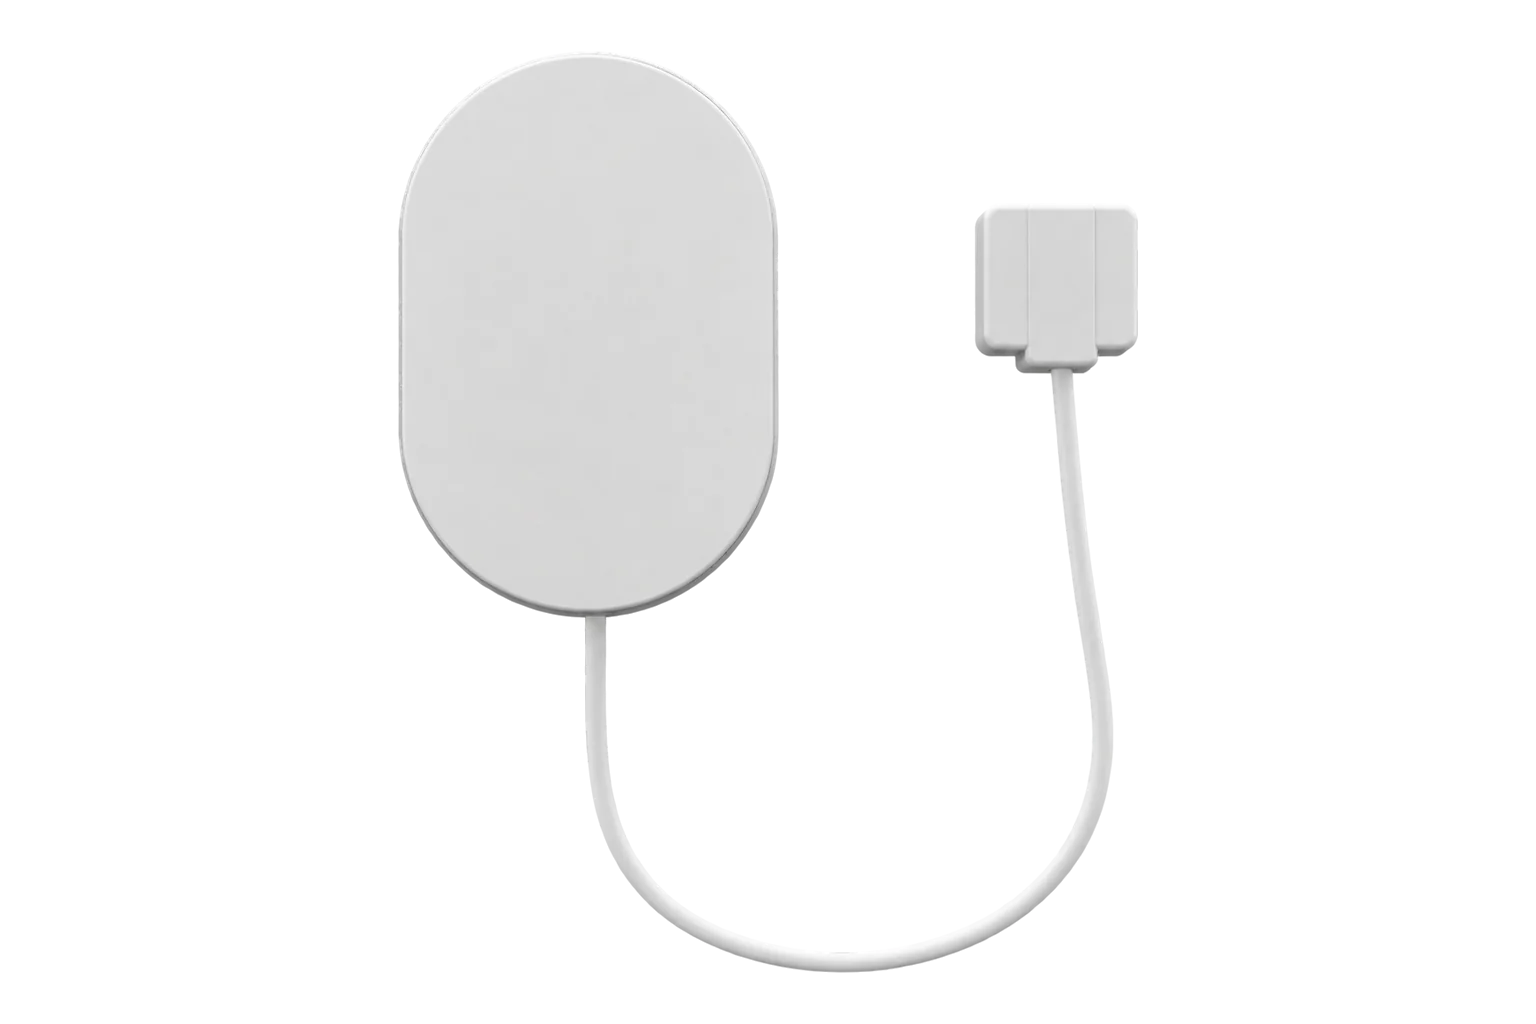
Counts the existing water meter's pulse output and preserves a running total
1 per pulse-output meter two channels on the ZPC-22 when two outputs are co-located
Minimum pulse width and gap 10 ms, up to 40 Hz, inputs rated to 35 V DC, 85 to 264 V AC supply
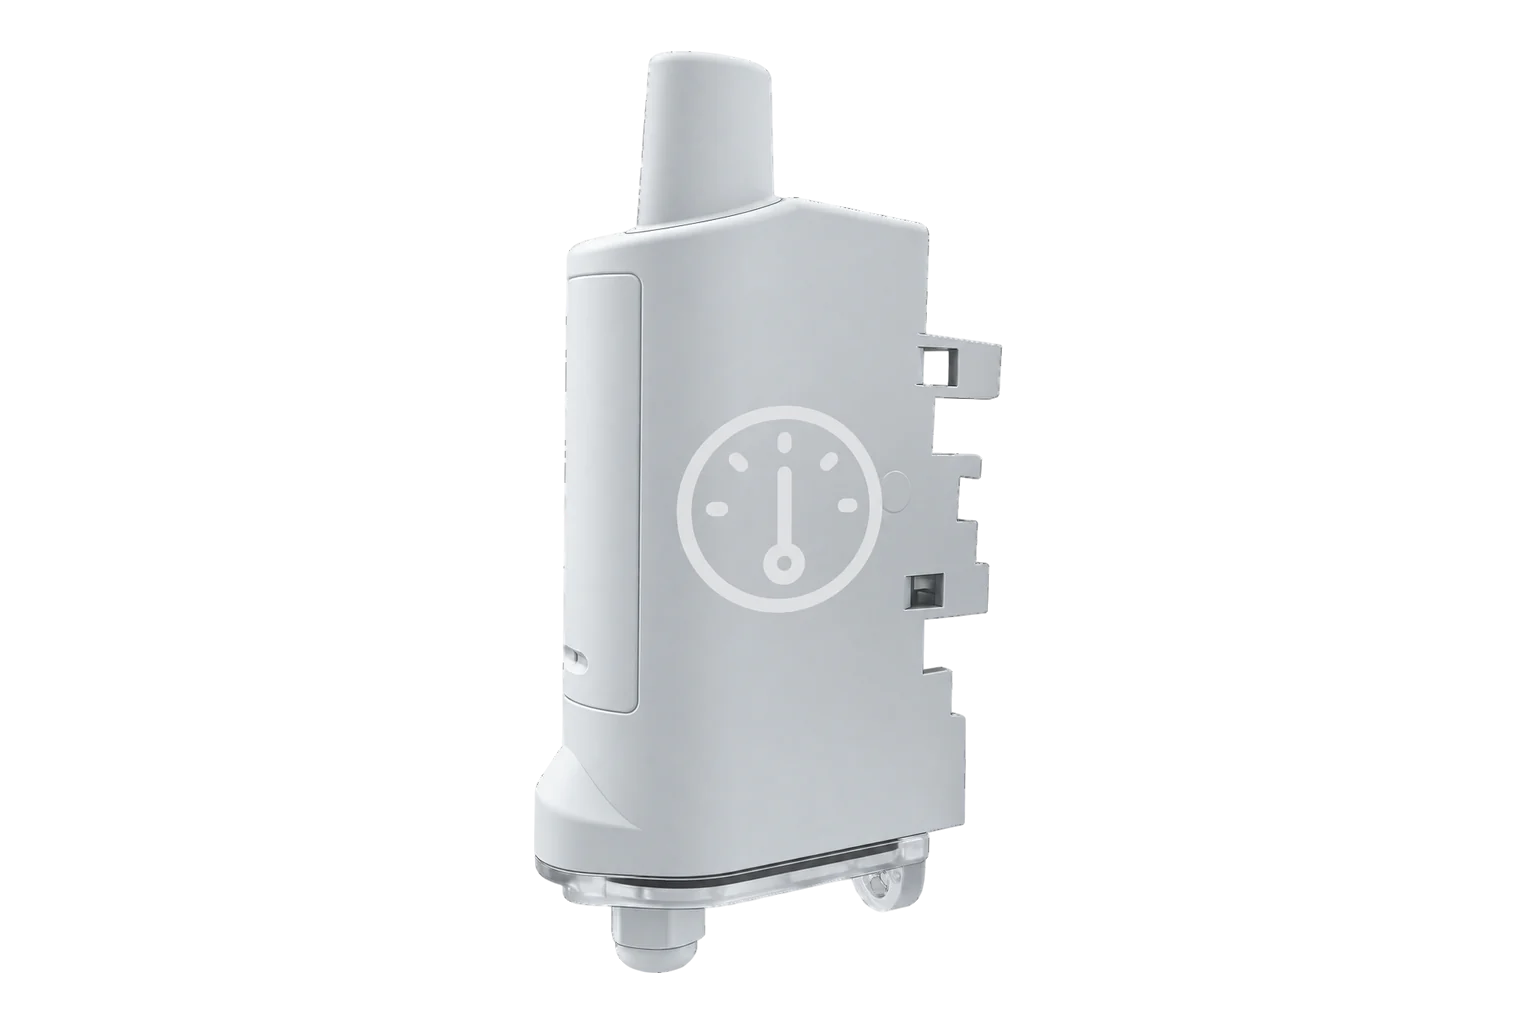
Collects the meter records, keeps local history and runs configured rules
1 per surveyed coverage area coverage and capacity checked on site
If an existing water meter exposes documented Modbus RTU registers
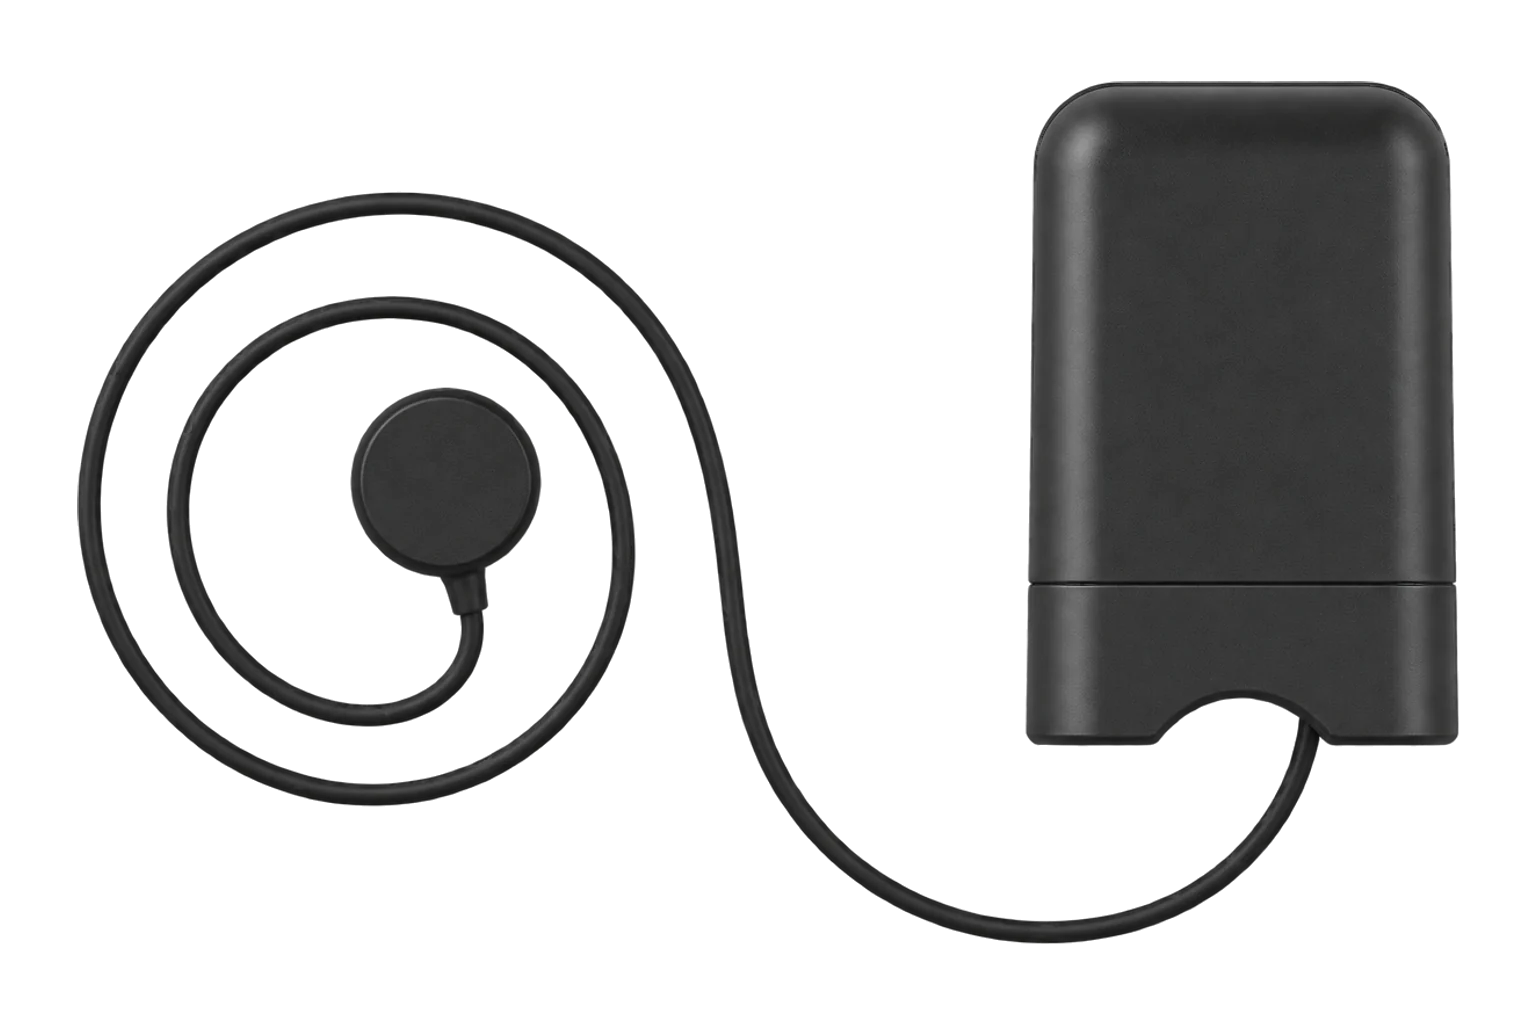
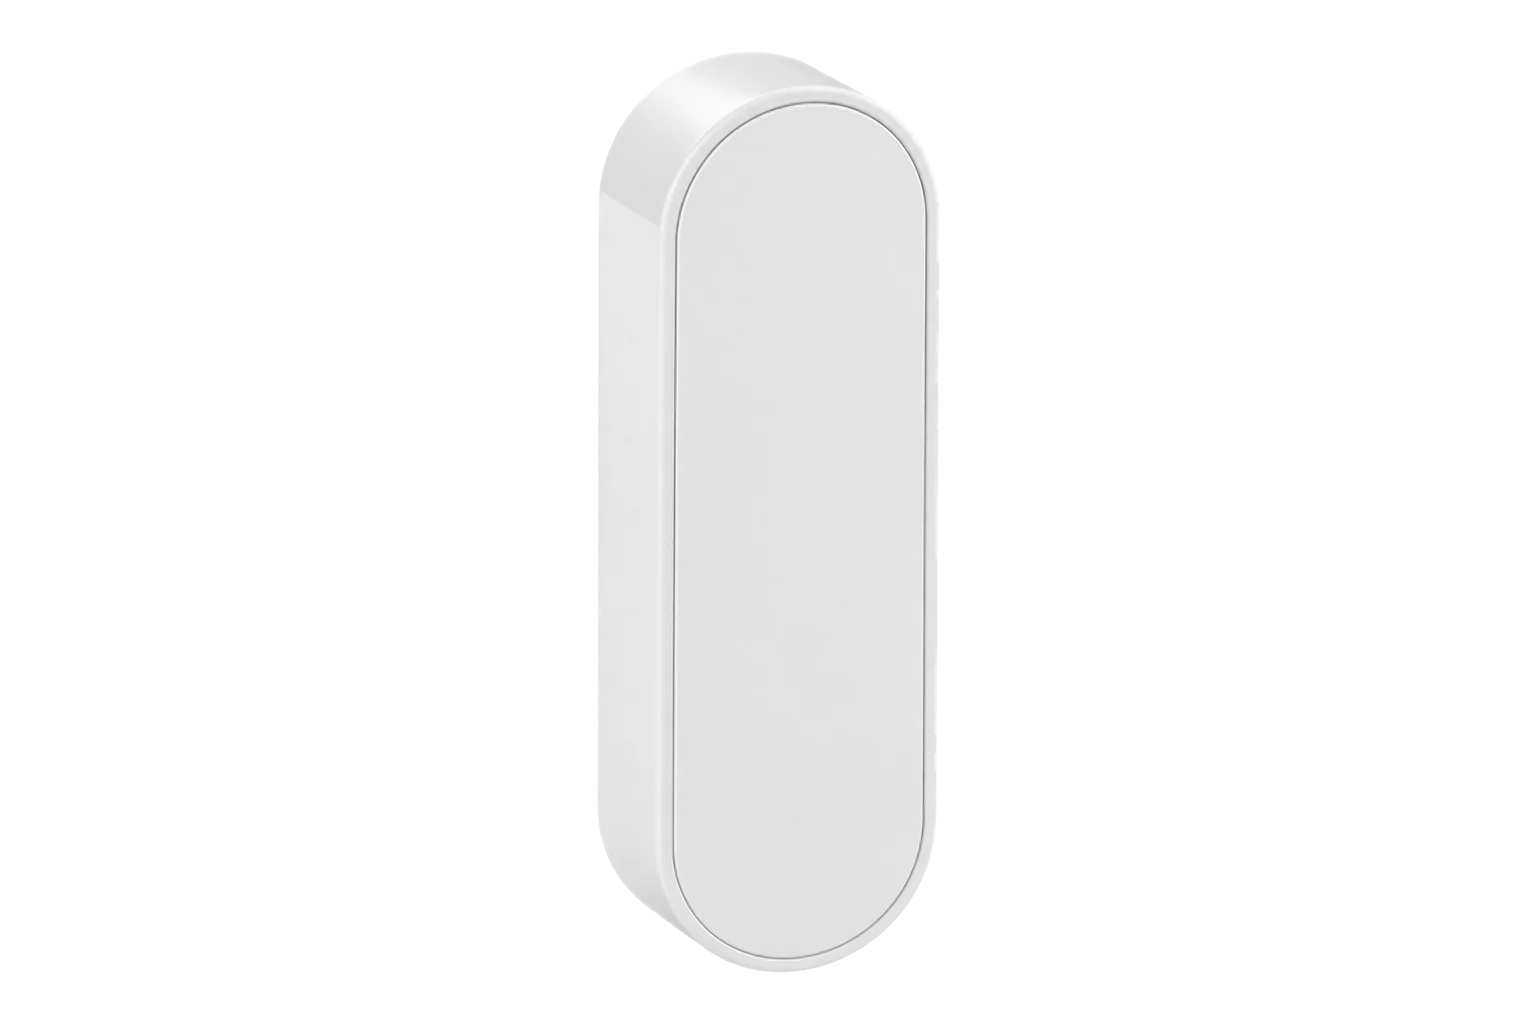
Reads documented volume, flow or status registers from an existing Modbus RTU water meter
1 per RS-485 segment up to 30 configured registers
Modbus RTU master over RS-485, up to 30 configured registers, mains powered
Build a water meter hierarchy that reconciles
Name each boundary before comparing totals. The main meter and its branches need the same units, aligned time windows and a clear account of unmetered uses.
How water meter readings reach Edge
Existing site and branch meters keep measuring the water. Their documented outputs feed the matching EpiSensor interface and report through the site Gateway.
- Wired
- Zigbee
- Edge
- Platforms
| Position | What it tells you | Reference | Sensor |
|---|---|---|---|
| Site supply meter | Total water entering the monitored boundary | Record serial number, units, multiplier, totaliser and timestamp before connecting the output EPA WaterSense | ZPC-20 (on this page), main boundary |
| Major end-use branch | Water attributed to a cooling tower, process, kitchen, irrigation or another named use | Prioritise the uses that materially affect the site's water balance DOE FEMP | ZPC-20 (on this page), one per selected branch |
| Modbus meter registers | The meter's own total, flow or status values when a documented register map exists | Confirm the displayed total against the decoded register value and its scale | ZMB-31 (on this page), optional register route |
Name the boundary before balancing. Main meter minus named branches is a residual, not automatically a leak. It can contain unmetered uses, timestamp mismatch, rounding and meter error.
Keep the meter's totaliser as the reference. A derived remote total should be reconciled against the meter display after installation and at planned intervals.
Investigate unexpected use on site. Continuous or off-schedule flow can be caused by a leak, a process, cleaning, irrigation or another legitimate load. Monitoring does not locate the cause.
Turn water totals into an operating record
Edge keeps the raw meter path, the converted engineering units and the context needed to interpret unusual consumption.
- Continuous use in a known closed period
- A configured rule can flag consumption during a period when the responsible person expects the selected boundary to be inactive. The event is an investigation signal, not proof of a leak.
- Unexpected change against a comparable schedule
- Compare like-for-like periods with the same operating context. Occupancy, cleaning, production, irrigation and weather can all change a legitimate water profile.
- Site and branch reconciliation
- Use aligned interval totals to calculate the named branch share and the unexplained residual. Keep units, timestamps and meter multipliers with the calculation.
- A meter that stops reporting
- A no-data rule distinguishes a quiet site from a missing measurement path so silence is never counted as zero consumption.
Commissioning checks
Commission the measurement path against the meter itself before using it for comparisons or alerts.
-
Record the meter and boundary
Photograph the totaliser and name the supply or branch, meter serial, units, multiplier and timestamp.
Pass when one record identifies the physical meter, its boundary and its starting total.
-
Prove the electrical or register interface
For pulses, confirm output type, polarity, width and pulse weight. For Modbus, confirm address, serial settings, register type, scale and units.
Pass when the documented output is inside the EpiSensor interface limits and one raw change is decoded correctly.
-
Observe a bounded water-use event
During an agreed test, compare the remote change with the water meter's own totaliser change.
Pass when the remote engineering-unit change agrees with the meter within the stated pulse resolution or register precision.
-
Reconcile the hierarchy over one period
Align the site and branch totals over the same start and end timestamps, then calculate the residual.
Pass when every input uses the same unit and period, and the residual is recorded without being labelled as a leak.
-
Prove stale-data handling
Disconnect one meter output or interface for longer than its reporting rule, then restore it.
Pass when Edge identifies the missing path, preserves the gap and does not silently turn it into zero use.
Limits of this measurement
The measurements make water use visible. They do not replace the meter, plumbing design or an investigation of the cause.
- An unexpected total or continuous-flow pattern can indicate a problem, but it does not locate a leak or distinguish one from legitimate use.
- Reading an existing output does not certify the water meter, its sizing, accuracy, installation, legal-metrology status or suitability for billing.
- A site-minus-branches residual includes every unmetered use plus timing, multiplier, rounding and meter errors; it is not automatically physical loss.
- Monitoring and alerts do not shut off the water. Any automatic isolation needs a separately engineered valve, control path, fail-safe state and operating approval.
Sources
- WaterSense at Work: Metering and Submetering (opens in a new tab) U.S. Environmental Protection Agency
- Advanced Metering Infrastructure for water management (opens in a new tab) (opens in a new tab) U.S. Environmental Protection Agency
- Water Metering Resources (opens in a new tab) (opens in a new tab) U.S. Department of Energy
- Pulse Counter datasheet (opens in a new tab) EpiSensor. Specifications, ranges and ordering codes.
Related
-
Pulse meter remote monitoring
A counter on the meter's existing pulse output, the pulse weight recorded once, and a totaliser reading that lets you prove the counts later. -
Tenant submetering and cost allocation
Meter each tenancy, the landlord supply and common services, and export a dated record that reconciles with the main meter. -
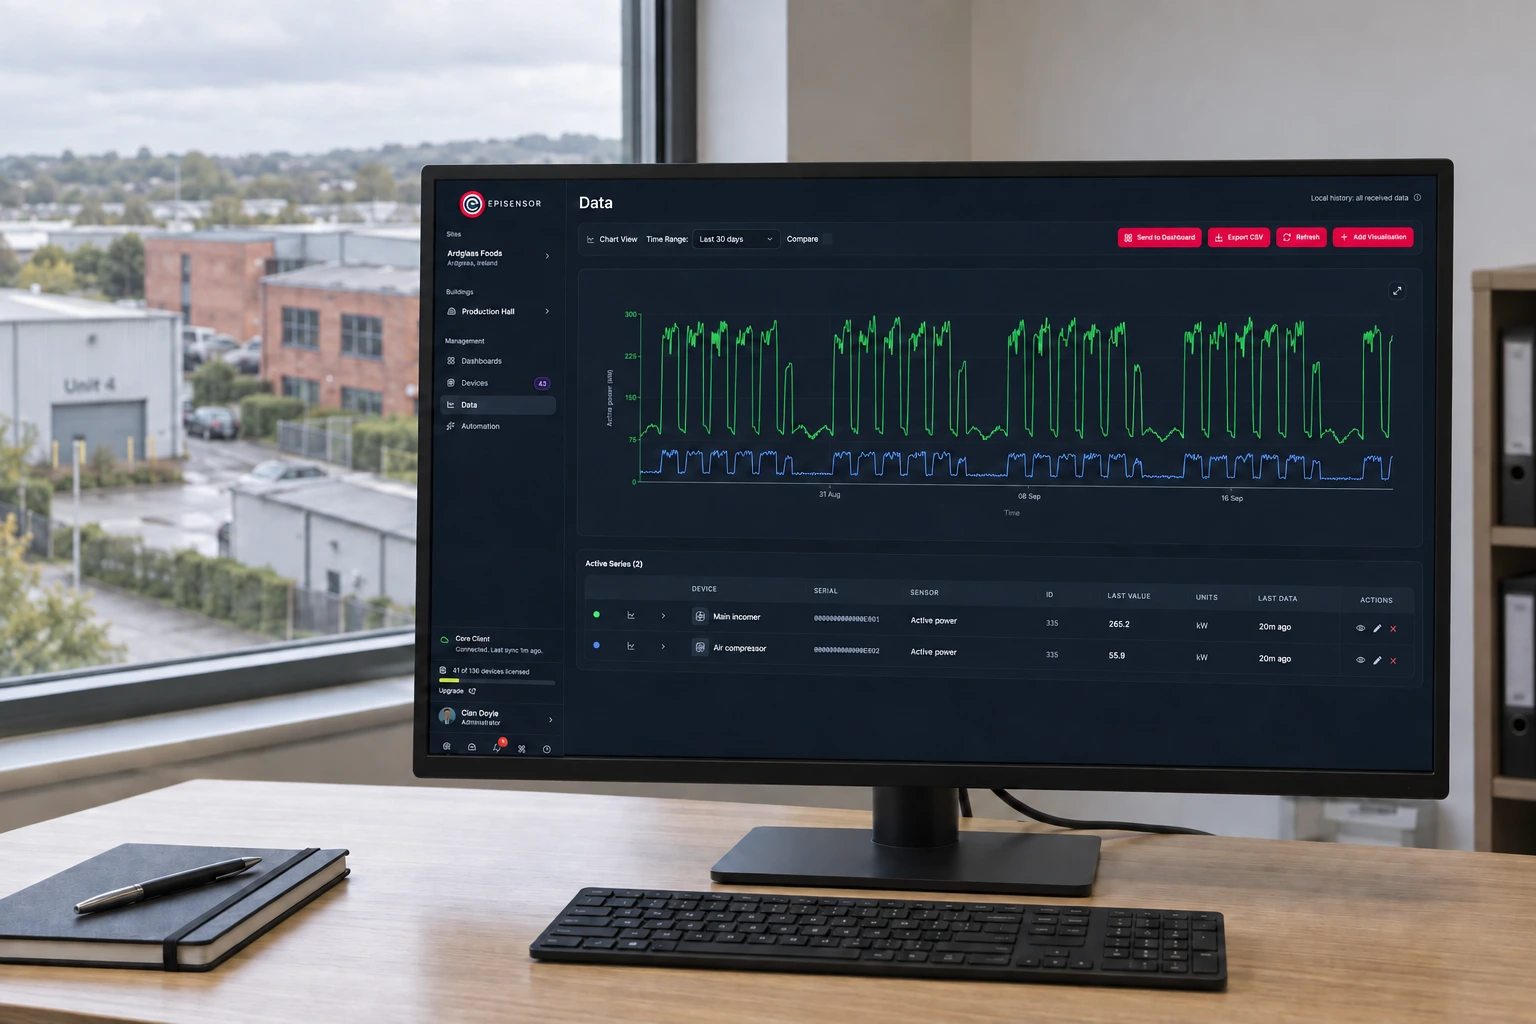
Multi-site energy monitoring
A Gateway on every site supports remote energy monitoring with local data continuity, a consistent point register and named owners for connections, credentials and change.


Map the water meters before choosing interfaces
Share the meter models, output manuals, site hierarchy and the periods you need to compare. An engineer can then confirm the acquisition route, Gateway coverage and commissioning checks.