Power quality and transformer capacity monitoring
Combine a suitable power quality instrument with demand, phase loading and temperature records to investigate disturbances and make a cautious transformer headroom assessment.
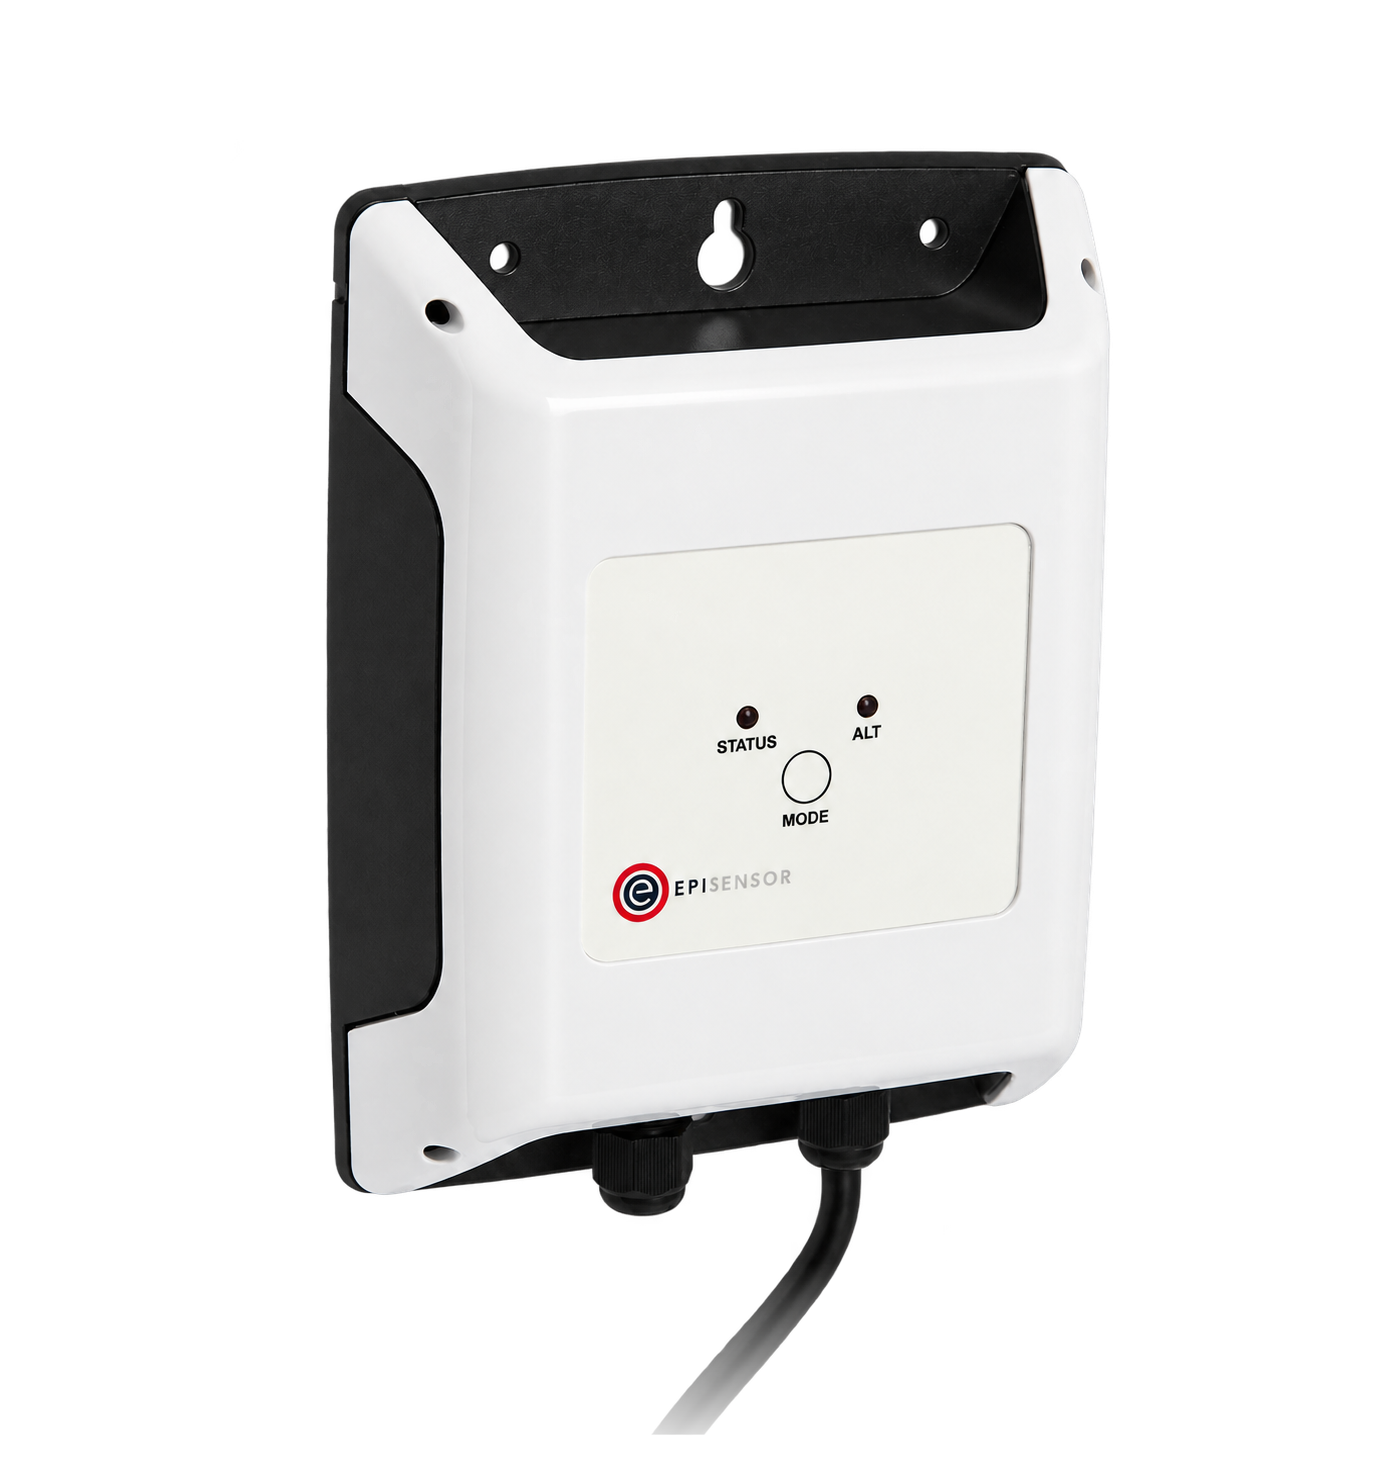
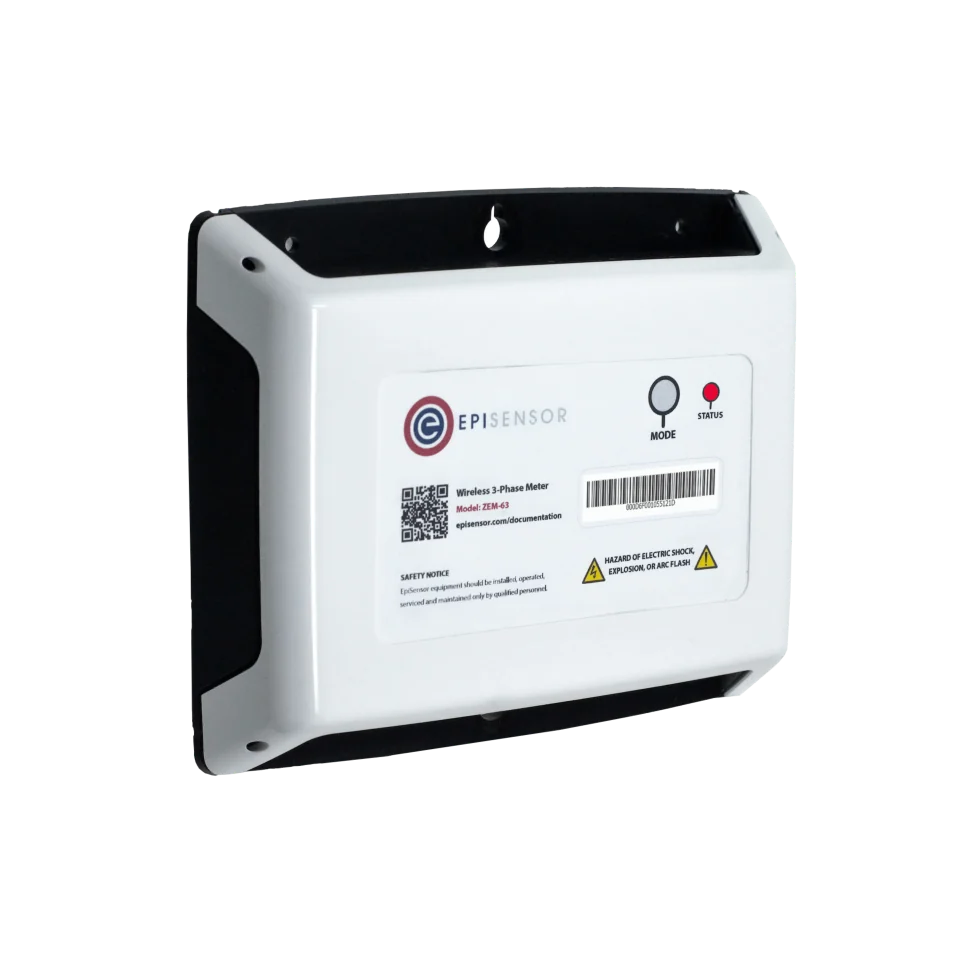
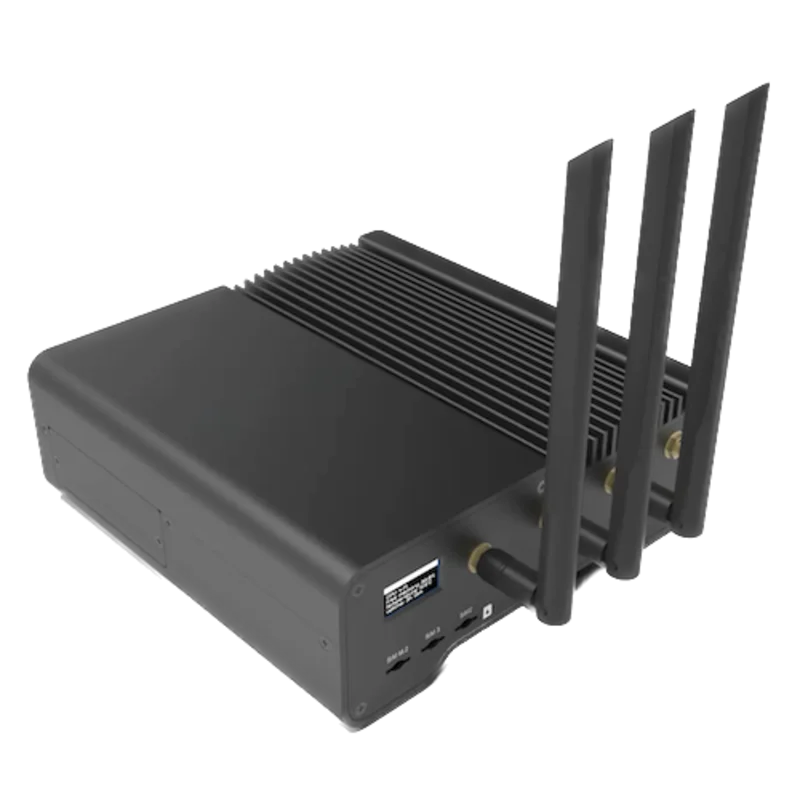
- Measure
- Voltage and current by phase, demand, unbalance, harmonics, power factor, frequency, event records and transformer temperature
- Calculate
- Recorded peak kVA, phase utilisation, event rates, data coverage and a stated planning allowance
- Sensors
- ZMB-31, reads an approved point list from a suitable third-party analyser without claiming its measurement class Modbus Interface datasheet
- On site
- ZGW-20 Gateway, keeps interval trends, events and data-quality status together in Edge Gateway datasheet
Choose the instrument for the decision, then preserve its evidence
Routine energy and demand trending, a contractual power quality survey and fault investigation need different measurement performance. State the required phenomena, measurement class, aggregation interval, event capture, transducers and clock accuracy before selecting an instrument. Use the transformer's nameplate, loading guide, cooling mode and thermal limits with the measured record. A spare kVA subtraction alone is not a capacity approval.
Hardware for power quality and transformer load monitoring
Use an instrument whose documented method fits the required power quality question. Edge can collect an approved read-only point list and align it with independent demand and temperature trends. It does not turn a general energy meter into a Class A power quality instrument.
Keeps approved analyser values, interval loading, temperature and data-quality records together in Edge
1 per site or acquisition zone up to 250 wireless devices
Use only where the analyser exposes a documented and commissioned read-only map
Reads approved summary values, event counters and health points from a suitable third-party power quality analyser
1 per available bus up to 30 approved registers
Modbus RTU over RS-485, function codes 1 to 6, 15 and 16; the approved path is restricted to reads
For interval demand and energy at a suitable low-voltage point, not disturbance waveform capture
Independent interval demand, energy, voltage, current and power-factor trend at a suitable low-voltage boundary
1 per required boundary three-phase, 3 or 4 wire
- Choose the CT rating for a suitable low-voltage measurement point: 120 A split-core, or 300 A, 1 kA and 3 kA Rogowski coils
Class 0.5S to IEC 62053-22 with its CTs, 110 to 480 V line to line, CAT III at 480 V
A surface or room probe is context, not winding hot-spot or insulation-life measurement
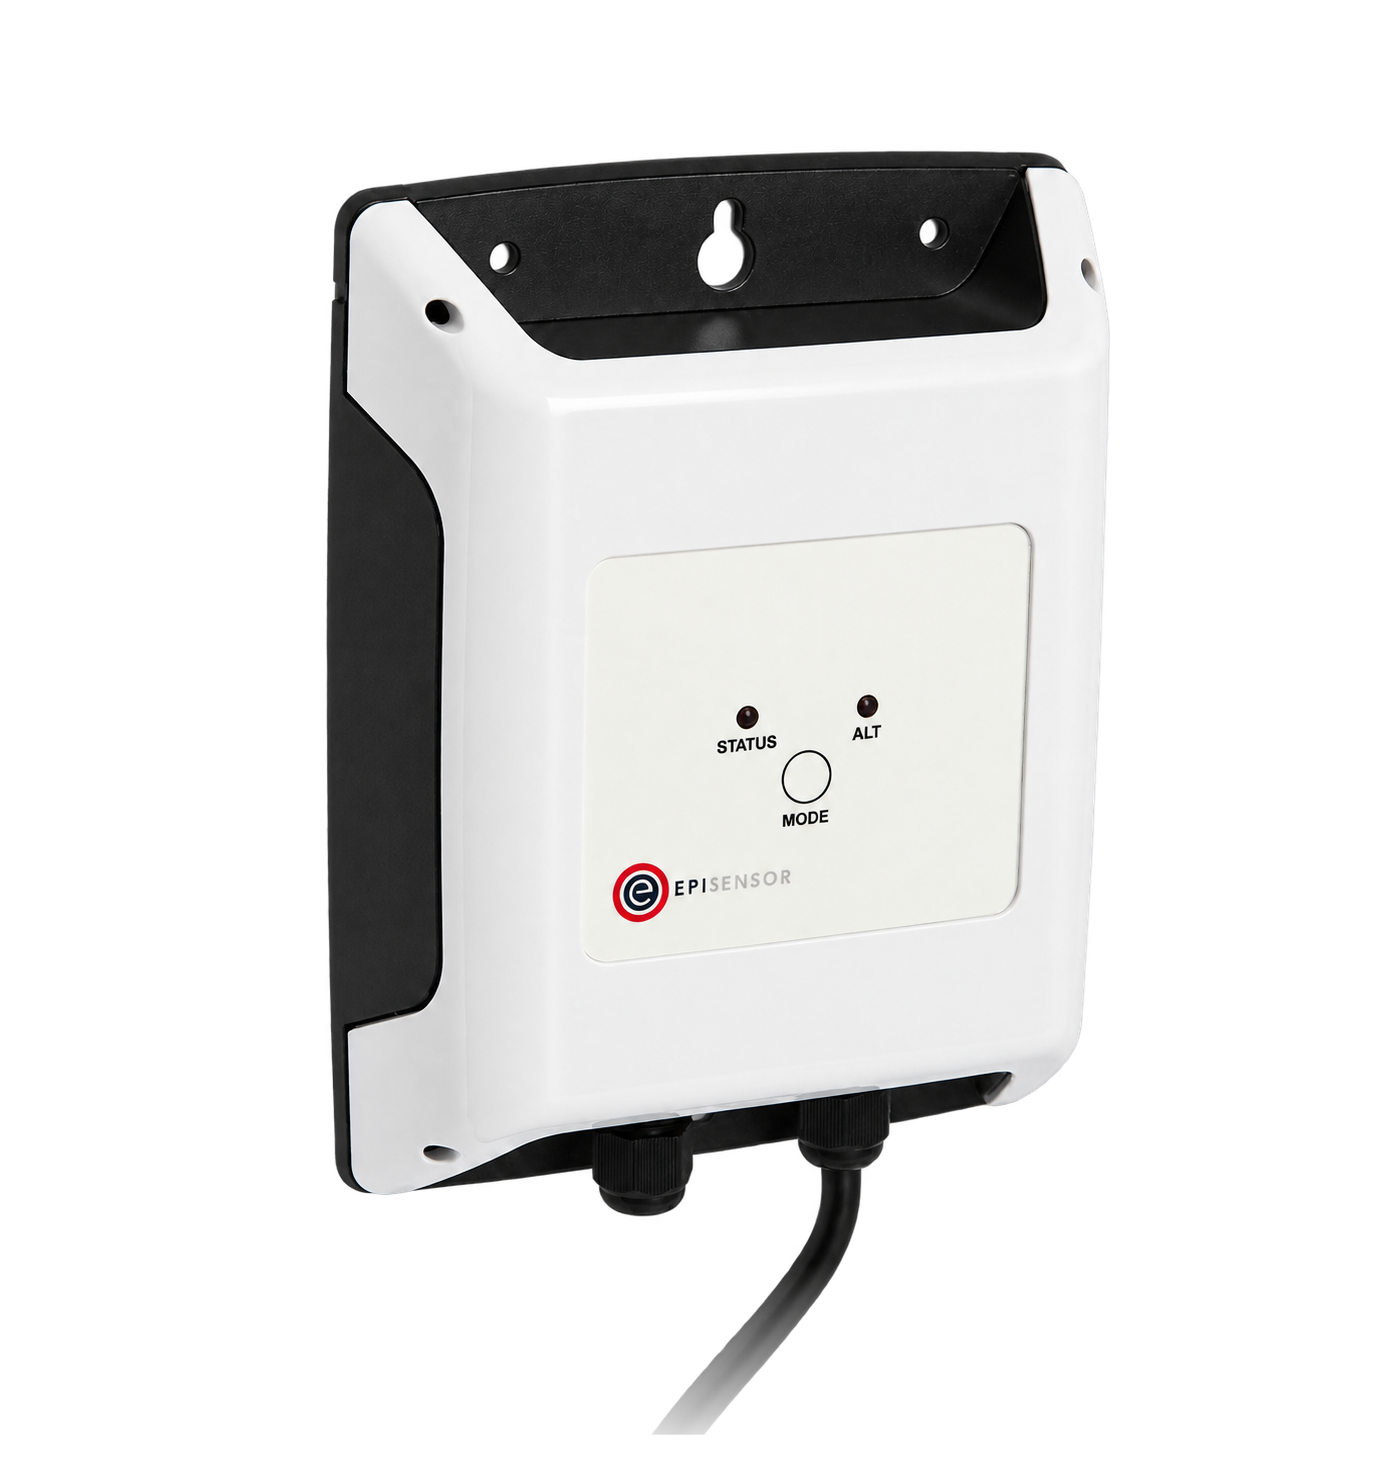
Records a declared transformer, enclosure or room temperature position beside the loading trend
1 per stated temperature point steel probe, 2 m lead
±0.2 °C from 0 to 70 °C, ±0.5 °C to 105 °C
Specify values, aggregation and event evidence together
A value name alone is not a power quality record. Keep the point of measurement, wiring, transducer ratios, method or class, aggregation, units, timestamp, clock status, quality, threshold and event identifier with the data.
From field measurement to Edge
Each field signal reaches its named EpiSensor interface, reports through the site Gateway and is handled locally in Edge.
- Modbus
- Zigbee
- Edge
- Platforms
| Position | What it tells you | Reference | Sensor |
|---|---|---|---|
| Voltage, current, frequency and unbalance | Steady operating range, phase loading, frequency and persistent asymmetry around exceptions | Retain phase values, the documented unbalance method and declared aggregation; a long average can hide a short disturbance IEC 61000-4-30 | ZMB-31 (on this page), per phase, with quality |
| Voltage and current harmonics | Waveform distortion, dominant orders and current-heating context for the transformer and neutral | Keep voltage and current distortion separate and retain individual orders when the decision needs them IEC 61000-4-7 | ZMB-31 (on this page), THD plus required orders |
| Demand, kVA and power factor | Recorded loading, the time of the peak and whether current is producing useful active power | Match the demand interval and method to the planning question; never average interval maxima into a new maximum Schneider ION reference | ZEM-65 (on this page), complete matching intervals |
| Voltage events and native records | When dips, swells, interruptions or rapid changes occurred and what the instrument retained | Preserve the event identifier, threshold, duration, affected phases, clock status and native record or waveform reference IEC 61000-4-30 | ZMB-31 (on this page), event index, not a recreated waveform |
| Transformer thermal context | Whether an external temperature trend moves with loading and ambient conditions | Surface or room temperature cannot be relabelled as winding hot-spot temperature or used alone to estimate insulation ageing IEC 60076-7 | TES-21 (on this page), declared position |
Measurement class belongs to the instrument and complete chain. A protocol value does not inherit a class because it has a familiar label. Confirm the analyser, firmware, voltage inputs, current transducers, wiring and time synchronisation required by the selected method. Record any change that reopens commissioning.
Harmonic current changes the loading question. Transformer heating depends on more than total kVA. Retain RMS phase and neutral current, current harmonic spectrum, cooling state and temperature evidence for the engineer. Do not apply a generic derating factor without the transformer design and an applicable method.
Clock quality is part of event evidence. Synchronise the analyser and Edge to approved time sources, retain clock state and timezone, and test behaviour after loss of synchronisation. Correlation with a trip, process alarm or utility event is weak when clocks drift or timestamps are rewritten.
Build headroom from measured evidence, not one peak number
Start with complete, quality-qualified intervals over a representative operating period. Keep seasonal production, planned outages, abnormal events and incomplete data visible. The result is an engineering input with stated assumptions, not an automatic permission to add load.
- Establish the usable rating
- Record transformer type, nameplate kVA, voltage ratio, impedance, cooling modes, tap position, service history and manufacturer limits. Oil-immersed and dry-type units have different loading evidence. Use the applicable transformer guidance and site conditions.
- Find coincident demand by phase and kVA
- Use the highest valid coincident interval at the declared boundary, retain phase currents and repeat the view across representative seasons and operating modes. State the interval, observation period, missing-data rule and whether temporary or standby loads were present.
- Add thermal and power quality constraints
- Review ambient and equipment temperature, voltage, unbalance, power factor, current harmonics, neutral current and event history beside the load profile. Capacity is constrained by the most relevant electrical, thermal, protection or operating limit, not only nameplate kVA.
- Model planned load and diversity explicitly
- Add each planned load with its expected kW, kVA, starting or inrush behaviour, harmonic character, duty cycle, simultaneity and growth allowance. Keep firm evidence separate from assumptions and test the worst credible coincident case.
- Let the engineer close the decision
- A qualified engineer checks protection coordination, conductor and switchgear ratings, voltage drop, fault duty, earthing, cooling, physical condition, redundancy and applicable rules. Record the accepted margin, assumptions and expiry or review trigger.
Commissioning checks
Commission the measurement chain and the capacity method before relying on a dashboard. A plausible trend can still have the wrong phase, ratio, timestamp, interval or electrical boundary.
-
The electrical boundary is unambiguous
Mark the analyser, independent meter and temperature positions on the current single-line diagram, including transformer side, CT and VT ratios, phase order and earthing arrangement.
Pass when every point has one physical location and the recorded ratios and wiring match the installed chain.
-
The analyser and live values are proved
Record model, firmware, measurement class, wiring, nominal values, aggregation, event settings and transducers, then compare live phase values with a suitable reference and local display.
Pass when the configuration supports the named phenomena and phase association, ratios, units, signs and scales meet the declared acceptance band.
-
Events keep their source identity
Use a manufacturer-approved test or a known recorded event to trace the Edge entry back to the analyser event identifier and native record.
Pass when timestamp, phases, threshold, duration and clock status agree, and missing native evidence is shown as missing.
-
Data gaps cannot become low load
Interrupt one approved data path and observe quality, last-good time, recovery and every capacity calculation that consumes the point.
Pass when stale or absent input is excluded or marked unknown and never appears as zero demand or improved headroom.
-
The headroom record can be challenged
Review the peak intervals, excluded data, seasonal coverage, phase loading, harmonics, temperature, planned-load assumptions and engineering checks with the person responsible for the installation.
Pass when each assumption has an owner and source, and the approved decision states its margin, conditions and review trigger.
What this monitoring record does not approve
The system supports investigation and engineering decisions. It does not replace the instruments, studies, authority or safety functions that a contract, standard or electrical installation requires.
- Edge is not a power quality analyser and does not recreate missing waveforms, high-speed samples or native event evidence from polled summary values.
- Monitoring does not certify compliance with IEC 61000-4-30, EN 50160, IEEE 519 or a connection agreement. The applicable boundary, limits, method and responsible party must be established separately.
- A calculated transformer margin is not approval for extra load. It does not replace protection coordination, fault-level, conductor, switchgear, earthing, voltage-drop, fire-safety, cooling or condition assessments.
- An external temperature probe is not a winding hot-spot sensor, and a measured temperature without its position, ambient context and equipment limit cannot establish thermal capacity.
- Operational measurements are not revenue or settlement measurements unless the complete approved metering and governance process says they are.
- This architecture excludes switching, tap control, capacitor control, protection settings, load shedding and analyser configuration. Those functions require separate authority and fail-safe design.
Sources
- IEC 61000-4-30:2025, power quality measurement methods (opens in a new tab) (opens in a new tab) International Electrotechnical Commission
- IEC 61000-4-7:2002 with Amendment 1:2008, harmonics and interharmonics instrumentation (opens in a new tab) (opens in a new tab) International Electrotechnical Commission
- IEC 60076-7:2018, loading guide for mineral-oil-immersed power transformers (opens in a new tab) (opens in a new tab) International Electrotechnical Commission
- IEEE 519-2022, harmonic control in electric power systems (opens in a new tab) (opens in a new tab) IEEE Standards Association
- ION reference, power monitoring applications (opens in a new tab) (opens in a new tab) Schneider Electric
- Modbus Interface datasheet (opens in a new tab) EpiSensor. Specifications, ranges and ordering codes.
Related
-
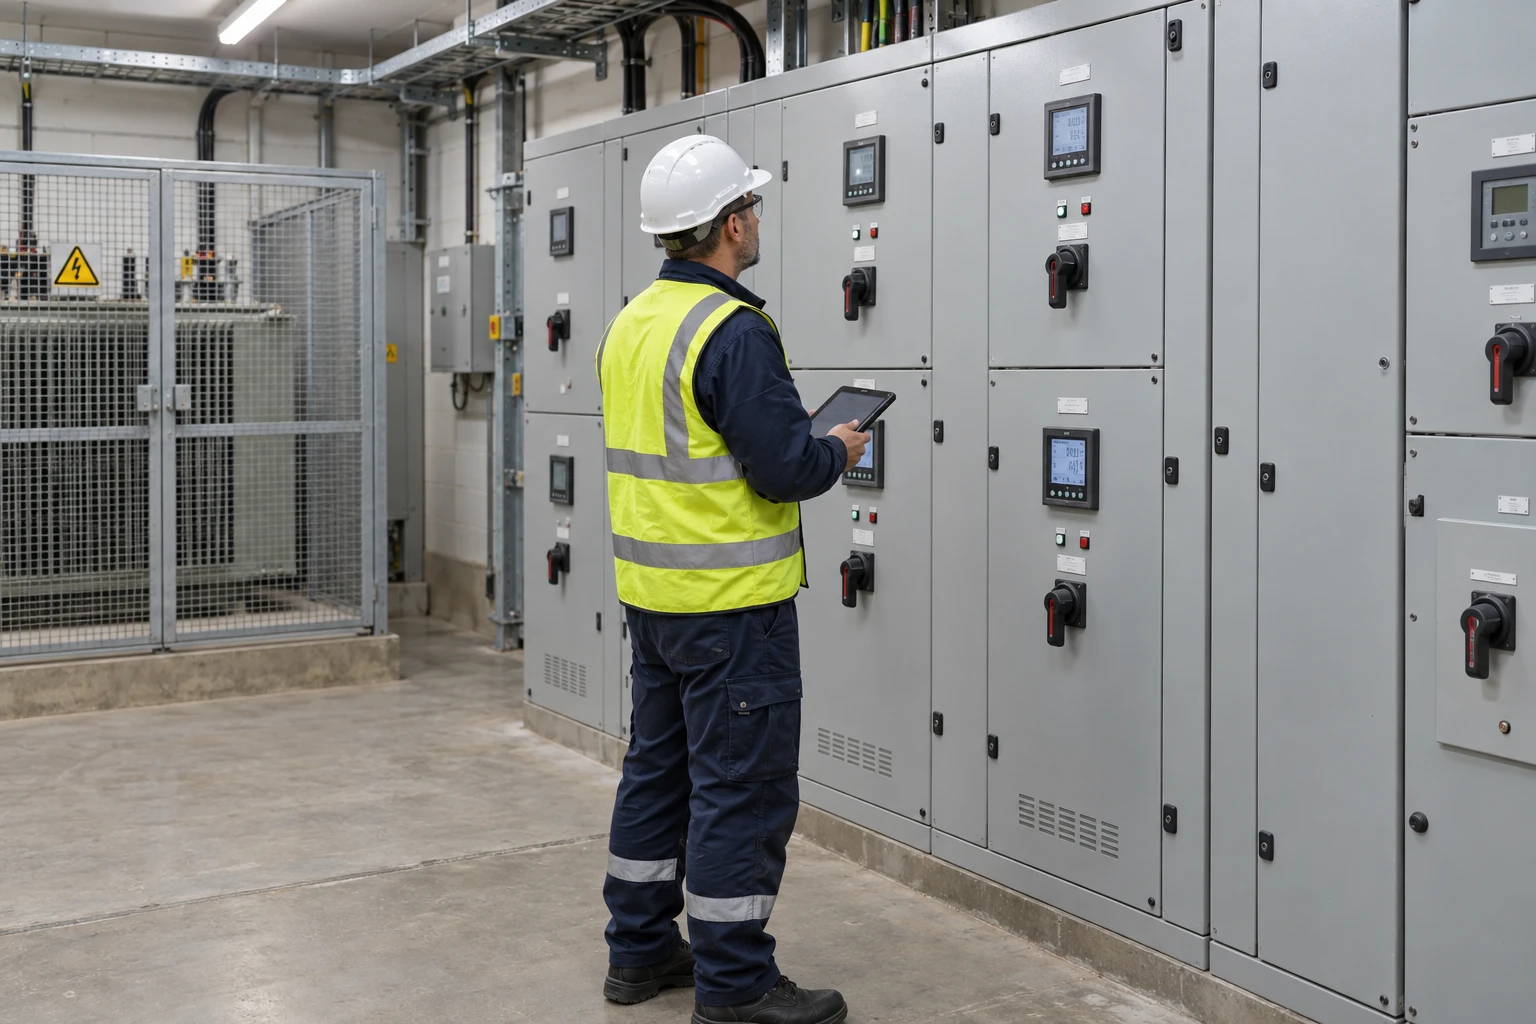
Transformer and distribution board monitoring
A meter at the incomer, meters on the feeders worth explaining, and a temperature probe where loading has to be read against heat. -
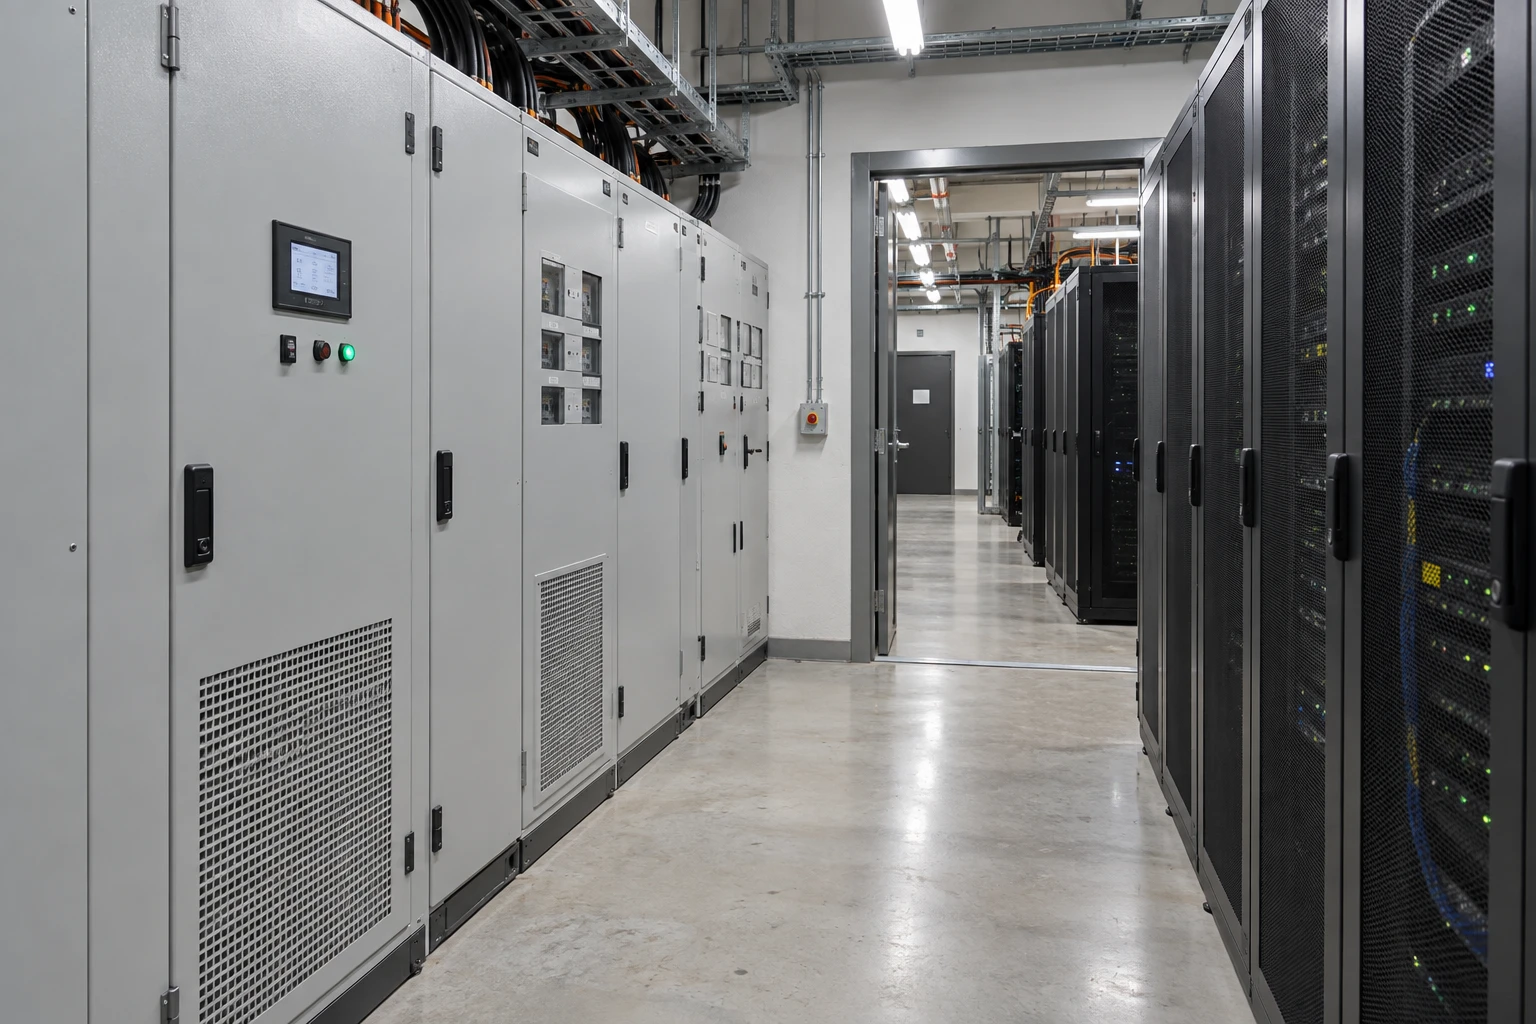
Data centre power monitoring and PUE inputs
Meter the facility incomer, UPS and IT supplies, and get matched energy totals for PUE and capacity reviews. -
Modbus meter integration for a BMS or SCADA system
A Modbus interface reads the meters and instruments on site, and Edge serves what it collects onward over Modbus TCP, MQTT or HTTP to the system that needs it.
- OverviewEnergy monitoring
- CalculatorTHD and TDD calculator
- CalculatorInterval demand calculator
- GuideThree-phase power formula and measurement
- GuidePower factor, kW and kVA explained
Third-party devices for this application
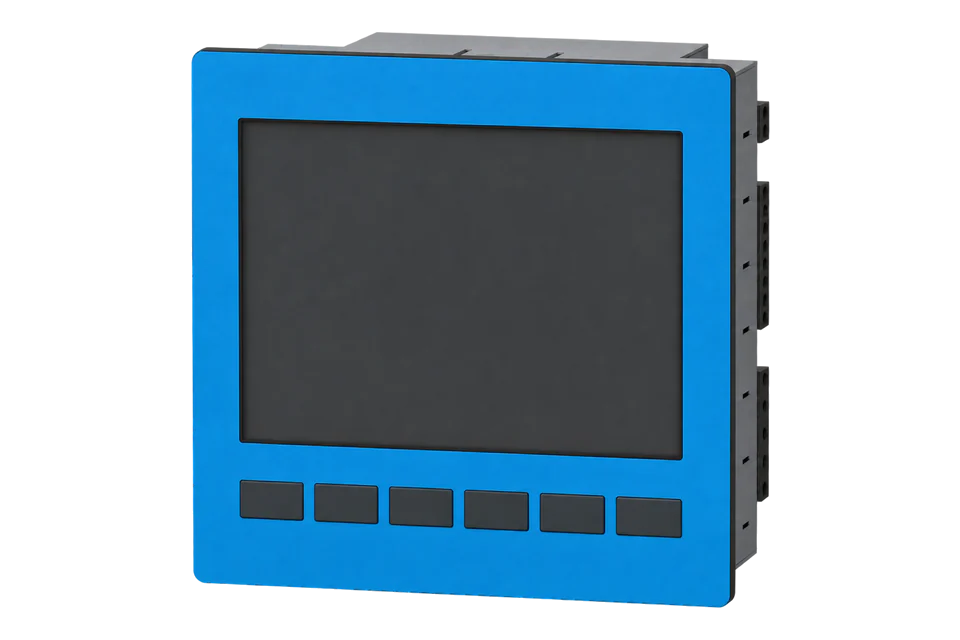
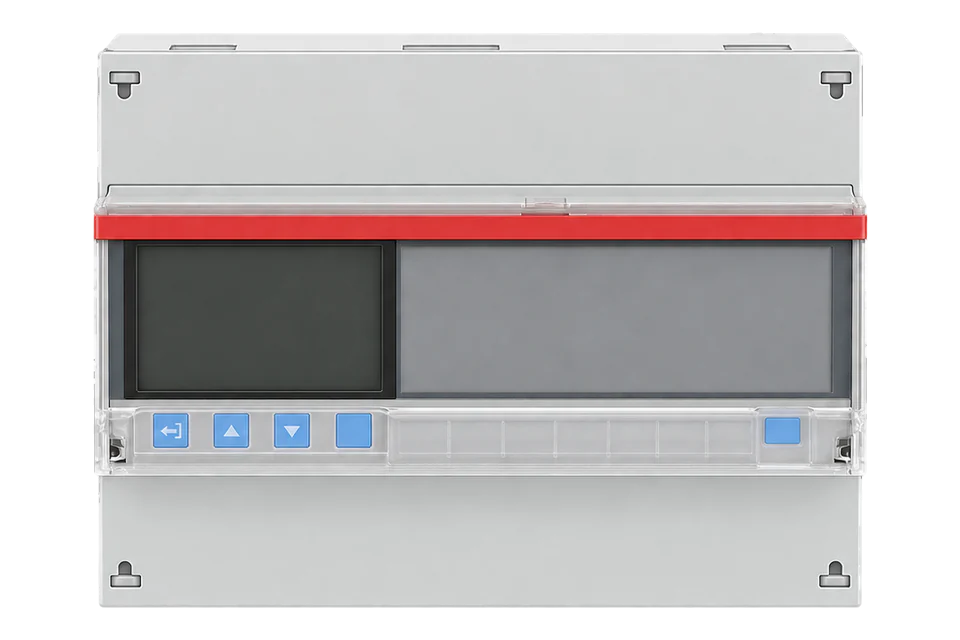
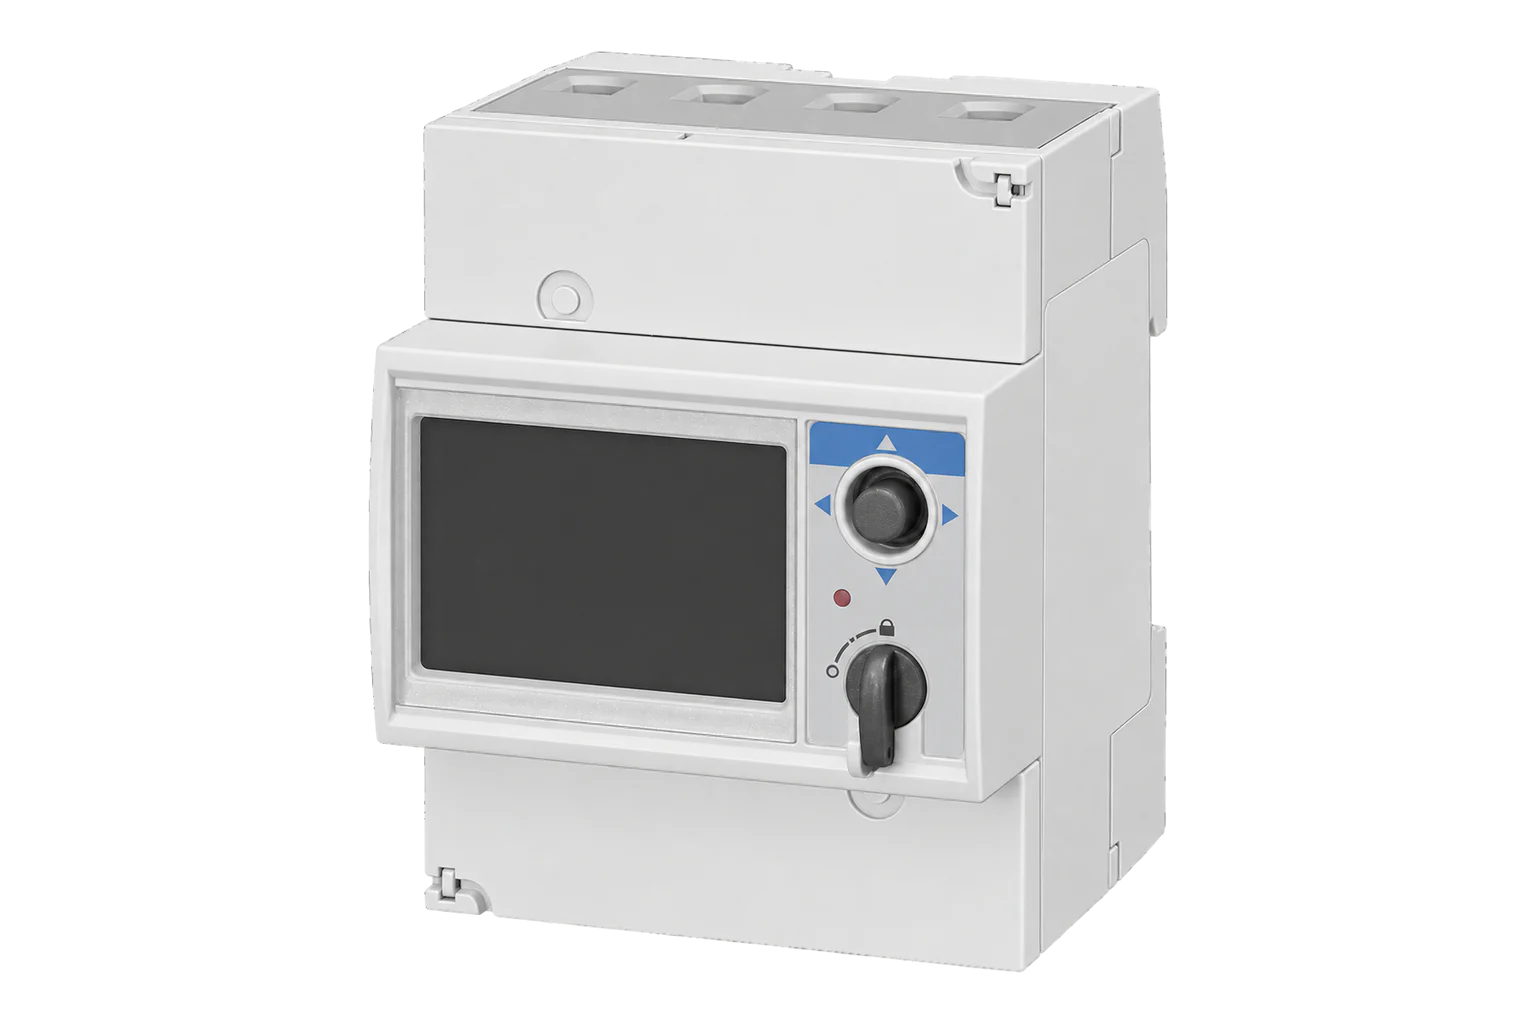
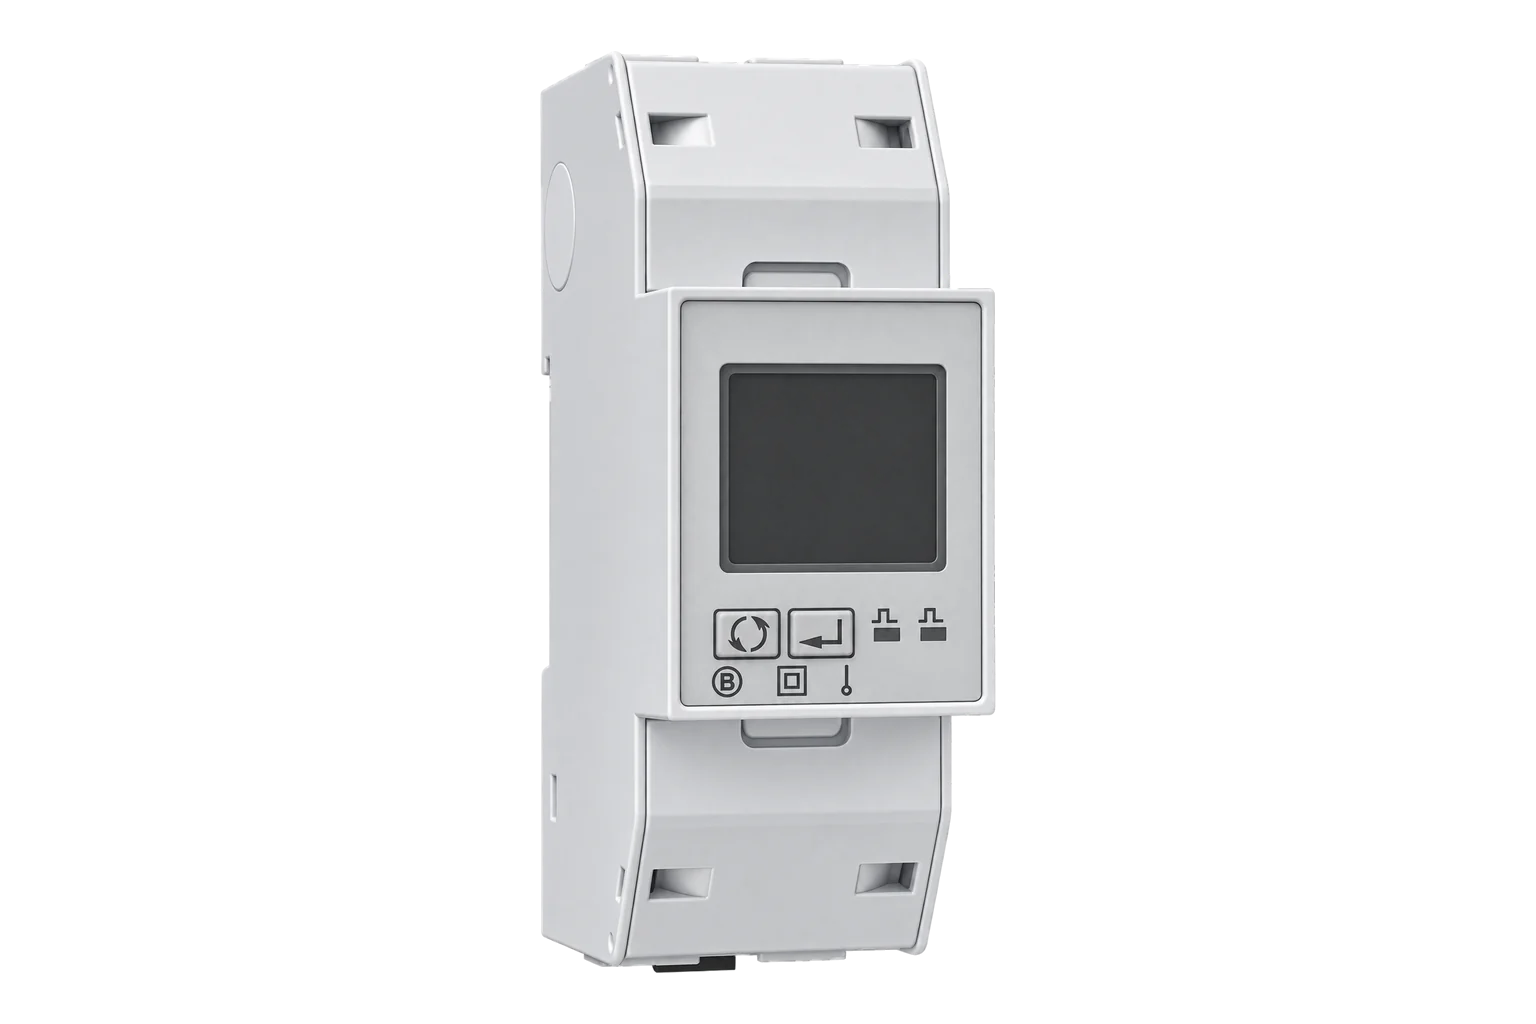
More in the Device Directory: Energy meters (62), Current transformers (7), Temperature and humidity sensors (21)
Define the evidence before selecting the monitoring path
Bring the single-line diagram, transformer nameplate, load schedule, existing instrument details, event question and planned-load assumptions to an engineer.