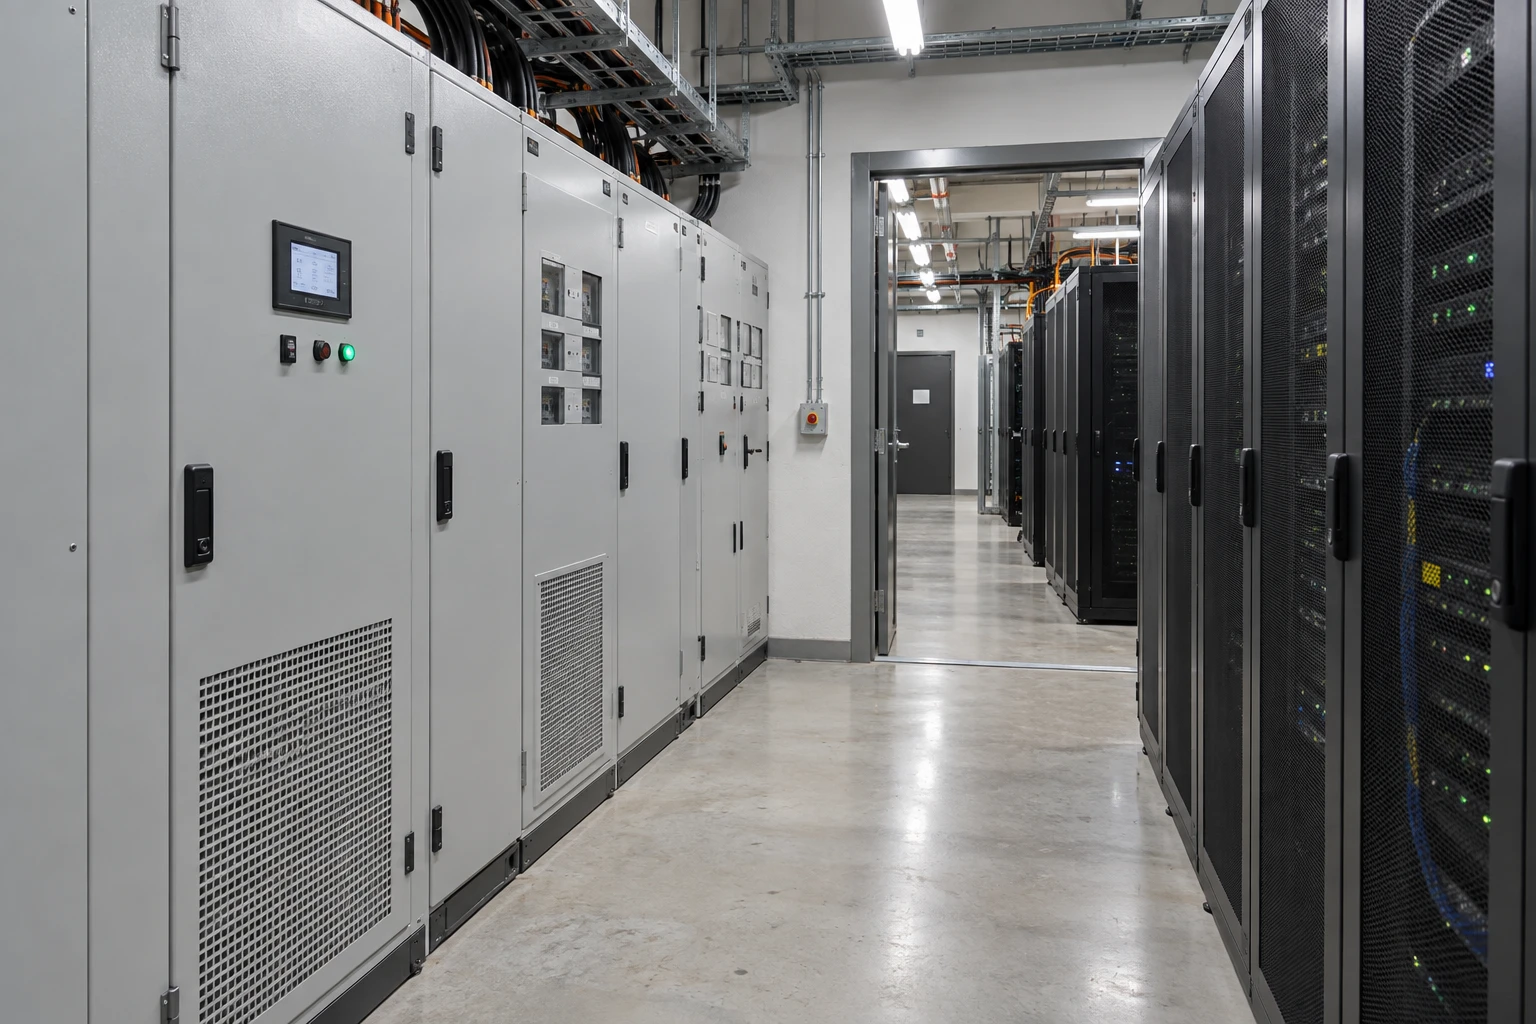
Data centre power monitoring and PUE inputs
Meter the facility incomer, UPS and IT supplies, and get matched energy totals for PUE and capacity reviews.
- Measure
- Facility, cooling, UPS and IT distribution supplies
- Calculate
- PUE monitoring needs facility and IT energy over the same period The Green Grid
- Sensors
- ZEM-65, monitors, and a ZMB-31 for UPS registers if needed
- On site
- ZGW-20 Gateway, Edge keeps local readings; a specialist platform is optional
Choose the electrical boundary before the dashboard
Start with the current single-line diagram. Follow the facility incomer through UPS input, UPS output and the power distribution units (PDUs) to the IT equipment, with cooling and other loads on their own branches. Each meter includes everything downstream of it, so count each load once. Note every A and B feed, bypass and alternative supply, and which operating states each meter still covers.
| Operator question | Required evidence | Decision it supports |
|---|---|---|
| Where is the electrical load? | kW and per-phase current on identified supplies, with the observation period | Locate heavily loaded paths and investigate trends with the responsible electrical engineer |
| What are the PUE inputs? | Facility energy and IT energy at one metering level, over the same start and end times | A PUE figure with its metering level and period stated beside it |
| Where does the power chain lose energy? | Upstream and downstream energy over the same period, and the battery’s charge state | Find where the energy goes between two meters, then confirm the cause with the UPS and distribution records |
Hardware for data centre electrical metering
Count the supplies you need to meter, then check what the UPS and PDUs already report before adding interfaces.
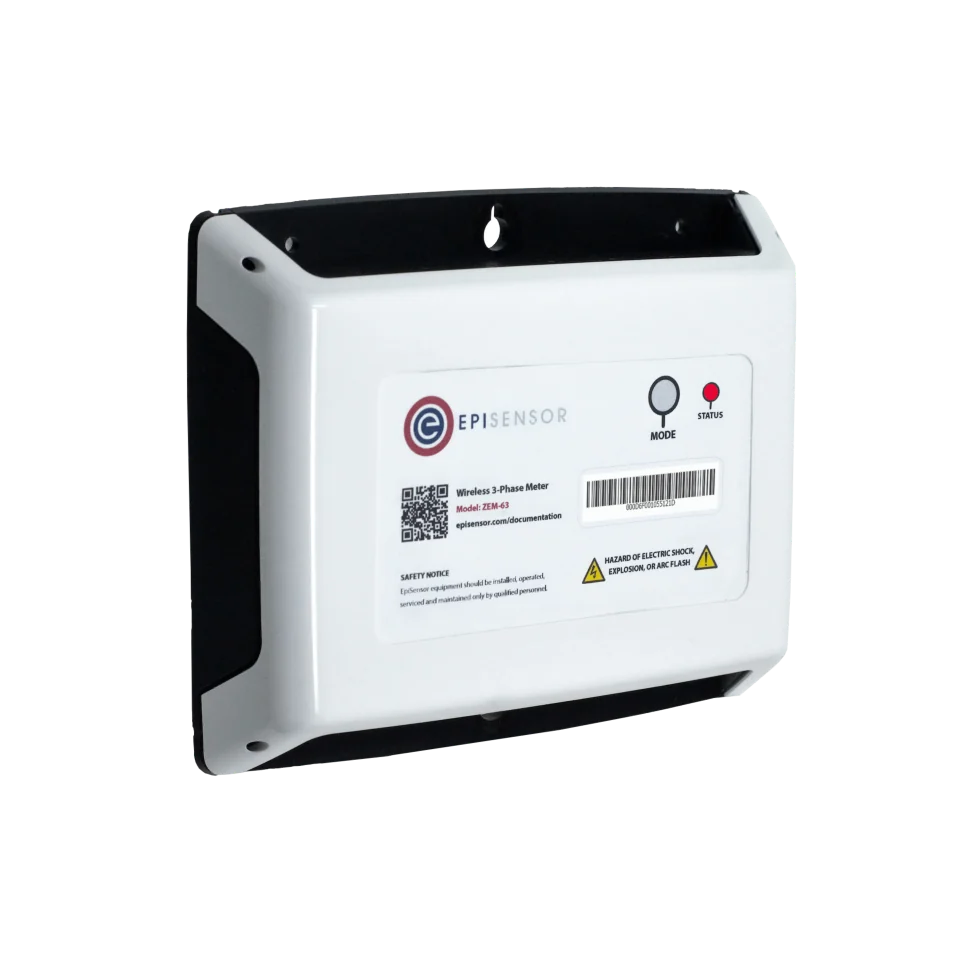
Measures voltage, current, power and energy at each selected facility, UPS, cooling or distribution boundary
1 per independently metered supply three-phase, 3 or 4 wire
- Choose CTs for each supply: 120 A split-core, or 300 A, 1 kA and 3 kA Rogowski coils
Class 0.5S to IEC 62053-22 for the meter and calibrated CTs together, 110 to 480 V line to line
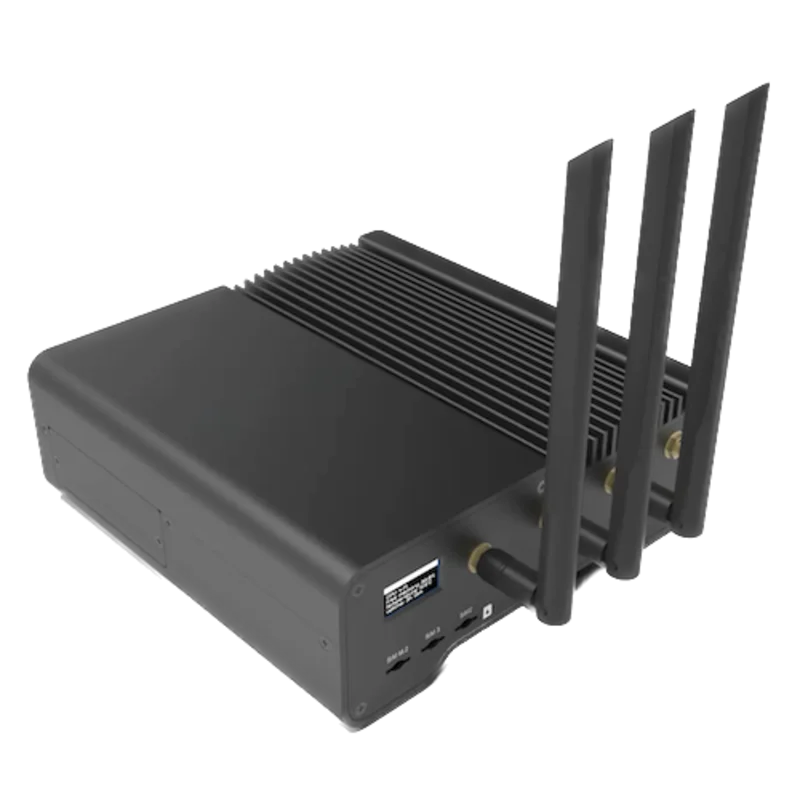
Collects the named electrical readings, retains local histories and runs configured monitoring rules
1 per surveyed coverage area radio coverage and point capacity checked for the site
If the equipment exposes documented Modbus RTU registers and the segment permits this master
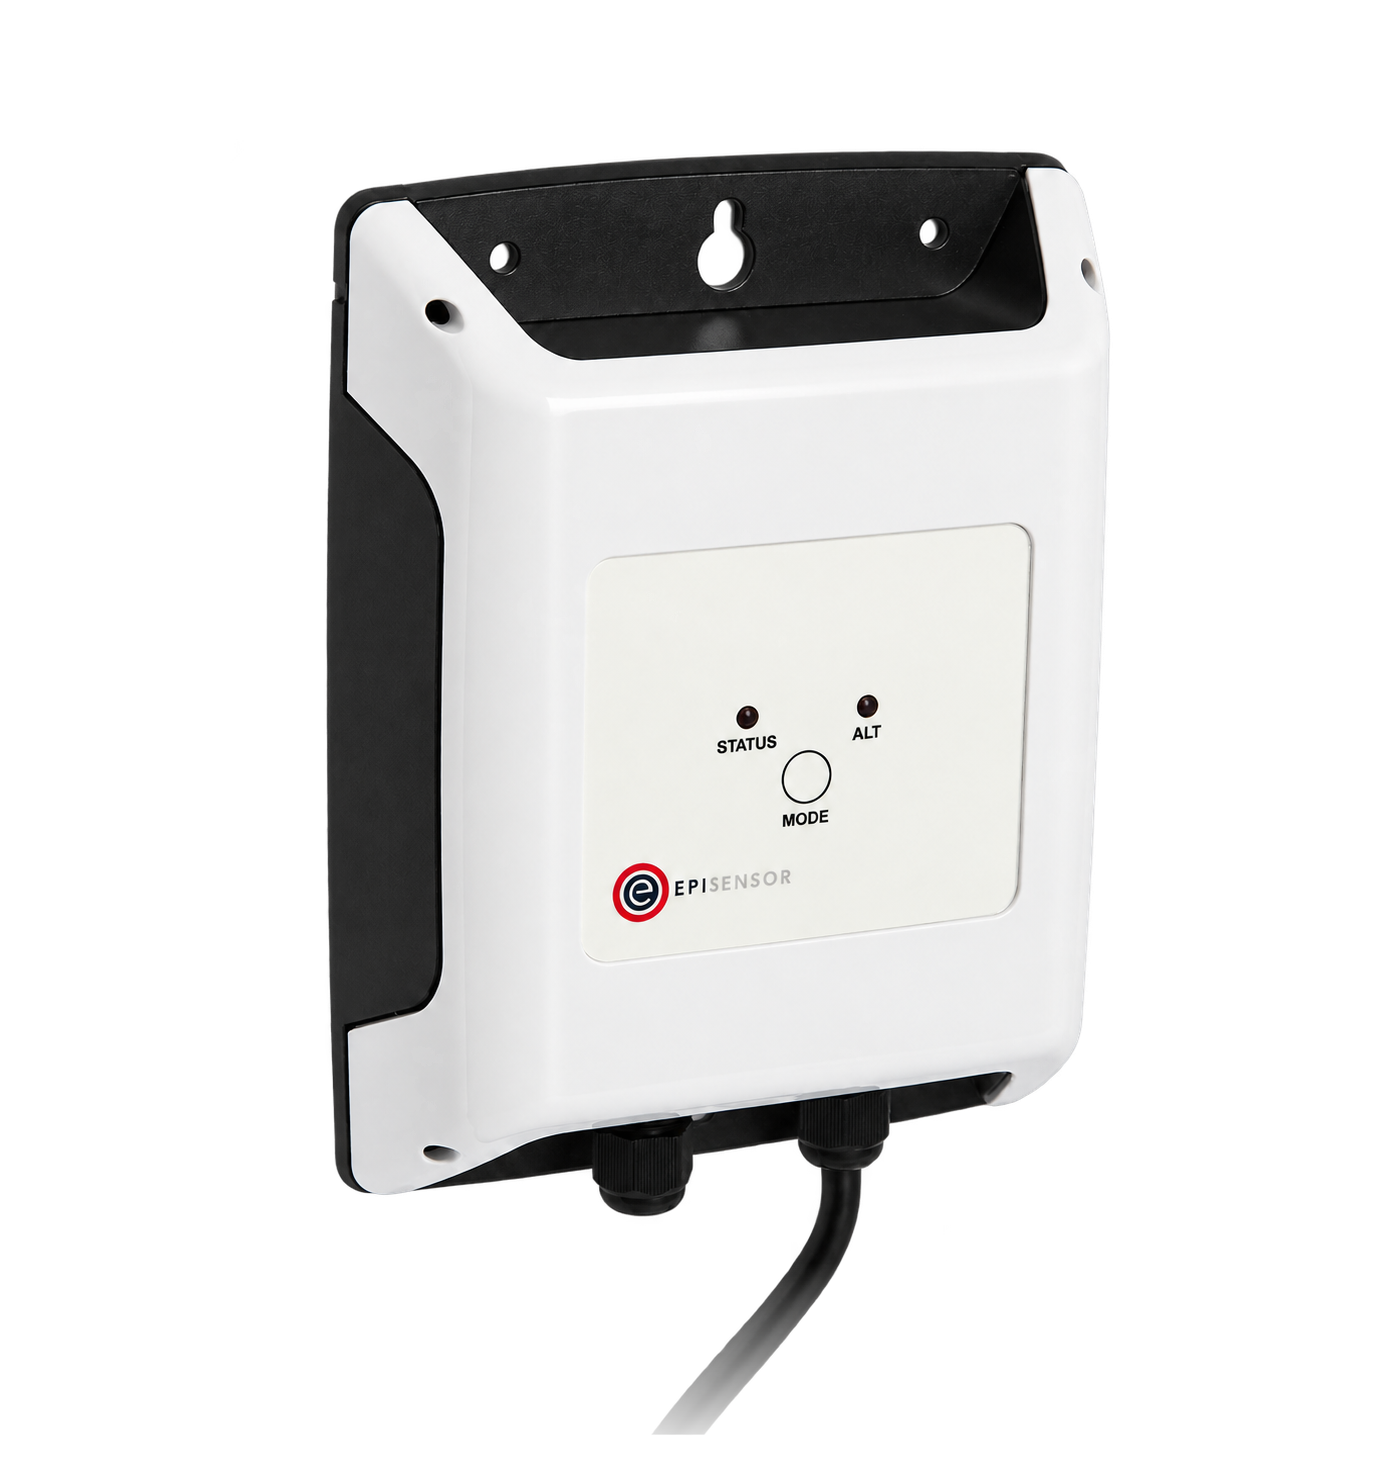
Reads documented energy, load or status registers from a compatible existing UPS, PDU or meter
1 per suitable RS-485 segment up to 30 configured registers
Modbus RTU master over RS-485, mains powered
Data centre energy monitoring starts at the named boundaries
Give every point a parent, a location, a unit and a job in the calculation. Keep the facility total, the IT total and the diagnostic meters apart.
From electrical boundaries to local power-chain records
Separate meters identify the energy boundaries. An optional read-only Modbus path adds equipment measurements or operating context where the exact model supports them.
- Wired
- Zigbee
- Edge
- Platforms
| Position | What it tells you | Reference | Sensor |
|---|---|---|---|
| Complete facility energy | Energy supplying the data centre, including IT, cooling, power delivery and supporting loads | Use an incomer dedicated to the data centre. Shared cooling and other energy sources need an explicit allocation method DOE and LBNL | ZEM-65 (on this page) |
| UPS input and output | Two levels in the power chain and their aligned energy difference | UPS input includes conversion and storage effects. The basic UPS-output IT proxy also includes downstream distribution losses; record any non-IT loads DOE and LBNL | ZEM-65 (on this page) |
| PDU output and IT input | The IT total, covering every supply path to compute, storage and network equipment | Choose one level, PDU output or IT-equipment input, include every A and B feed, and read parent or child meters for the total, never both The Green Grid | ZEM-65 (on this page) |
| Cooling and support loads | Where non-IT energy is used within the measured facility total | Cooling, fans, pumps and lighting explain the overhead; facility minus IT also includes distribution losses DOE and LBNL | ZEM-65 (on this page) |
| Existing equipment data | Mapped cumulative energy, load or bypass and battery status when the exact UPS or PDU exposes them | Verify the model, firmware, register map, units and timestamps. The ZMB-31 reads Modbus RTU on RS-485; SNMP or Modbus TCP equipment needs another route Modbus Interface datasheet | ZMB-31 (on this page), optional |
Leave PUE blank when a supply is missing. If an IT feed, the cooling or another energy input is missing, keep the readings you have as branch data, and label any estimate as an estimate.
Explain the gap between two meters. Upstream minus downstream energy can include unmetered auxiliaries, distribution loss, meter uncertainty, clocks out of step and changes in stored battery energy. Check bypass state and charging before calling the difference UPS loss.
Take load trends to the capacity review. Trend kW and per-phase current against limits approved by the site's electrical engineer, and record the sampling interval and observed peaks. Judge headroom on kVA and peak current rather than average kW. Cable and breaker ratings, derating, phase balance, UPS limits and the A and B failover state remain engineering inputs.
How to calculate PUE from aligned energy inputs
Calculate PUE from energy over the same period, not from instantaneous kW: facility kWh ÷ IT kWh. Blank the result when an input is missing or stale or IT energy is zero, and state the metering level and the period beside it. Use the ratio of the energy totals rather than an average of interval ratios.
PUE for the period = Efacility ÷ EIT
non-IT energy = Efacility − EIT- Efacility
- facility energy for the period, kWh
- EIT
- energy from non-overlapping IT feeds for the same period at the chosen metering level, kWh; it must be greater than zero
Worked example
Over one 24-hour period the facility incomer records 1,500 kWh and the PDU outputs record 1,000 kWh. PUE for the day is 1,500 ÷ 1,000 = 1.50, with 500 kWh outside the IT load. If the cooling feeder used 350 kWh, the other 150 kWh is lighting, other overhead and losses. Report it as a daily PUE at PDU output: cable losses after the PDUs count as IT.
In Edge
Edge keeps the readings on site for the calculation and for any receiving platform. Take interval kWh from the differences between cumulative register readings, allowing for resets and rollover, rather than adding up kW readings. Suppress the ratio when a required input is stale, incomplete, misaligned or has a zero denominator; keep a missing feed as a gap, and send the no-data alarm to a named operator. A slow sampling interval cannot reveal unknown within-period peaks.
Commissioning checks
Commission under the site’s approved change procedure, with the facilities and IT owners agreeing the same electrical map.
-
Account for every operating path
Mark incomers, UPS, bypass, PDUs, A and B feeds, cooling and auxiliaries on the single-line diagram. Identify shared services, generator operation, storage and every load outside the selected boundary.
Pass when facility and IT energy each cover every supply in every operating state you report, and every load is counted once.
-
Verify the electrical channels
A competent electrical installer checks suitability, isolation and the installation procedure, then verifies CT rating, orientation, voltage references and phase association against a suitable reference measurement.
Pass when each named meter responds to its intended circuit with credible per-phase values, direction and energy increments, and the installation needs only the interruptions to critical supplies that were approved.
-
Qualify existing UPS and PDU registers
Check model, firmware, address, data type, byte order, scale, units and update rate against the equipment display. Establish bus ownership before adding a Modbus RTU master and use read-only acquisition.
Pass when the mapped points match the documented equipment values, the existing master keeps polling normally and every Edge point is read-only.
-
Reproduce one complete energy period
Use recorded register values at identical start and end timestamps. Check resets, time-zone conversion and gaps, then reconcile the facility meter with non-overlapping branches using a tolerance based on the installed measurement uncertainty.
Pass when the raw readings reproduce the ratio, the residual is explained and the selected UPS-output, PDU-output or IT-input boundary appears beside the result.
-
Prove invalid inputs stay invalid
Replay missing, stale, out-of-step and zero IT energy inputs in an isolated calculation test. Use an approved communications test for the no-data rule without switching off a critical load.
Pass when invalid input suppresses the ratio, the operator receives the no-data condition and restoration keeps the gap as a gap.
-
Agree the load-review limits
Record the engineer-approved per-phase and UPS limits, logging resolution and normal and failover configurations. Check that any configured threshold rule names the affected path and accountable recipient.
Pass when the operational trend is labelled with its observation period and resolution, and any decision to add IT load goes through the site's capacity review.
Limits of this measurement
These readings support decisions about critical infrastructure. The site’s electrical, IT and operating procedures still make them.
- This monitoring does not replace DCIM, an electrical power management system, protective relays, UPS controls or the site’s incident response. Edge has no ready-made PUE dashboard or capacity model: the calculation is set up for each site. Monitoring does not guarantee uptime.
- PUE describes infrastructure energy overhead; it does not measure useful computing work, server utilisation, carbon intensity or overall business efficiency.
- Different IT metering levels include different distribution losses. Only compare results with the same metering level, period and data coverage.
- If the site also uses gas, on-site generation or shared cooling, the incomer alone is not the facility total. Meter those supplies too before you calculate PUE.
- Interval trends are not protection-grade transient recording, breaker coordination, power-quality certification or proof of redundancy. They cannot authorise additional IT load or a failover test.
- Rack inlet temperature and humidity need their own sensors, placement and escalation plan. Electrical load does not establish thermal safety.
Sources
- Data Center Metering and Resource Guide (2017) (opens in a new tab) U.S. Department of Energy and Lawrence Berkeley National Laboratory
- PUE: A Comprehensive Examination of the Metric, White Paper 49 (2012) (opens in a new tab) The Green Grid, hosted by Lawrence Berkeley National Laboratory
- Wireless 3-Phase Electricity Monitor datasheet (opens in a new tab) EpiSensor. Specifications, ranges and ordering codes.
Related
-

Server room and rack temperature monitoring
Probes at the rack inlet and exhaust, a separate humidity transmitter, and each point’s position, history and alarms kept together in Edge. -
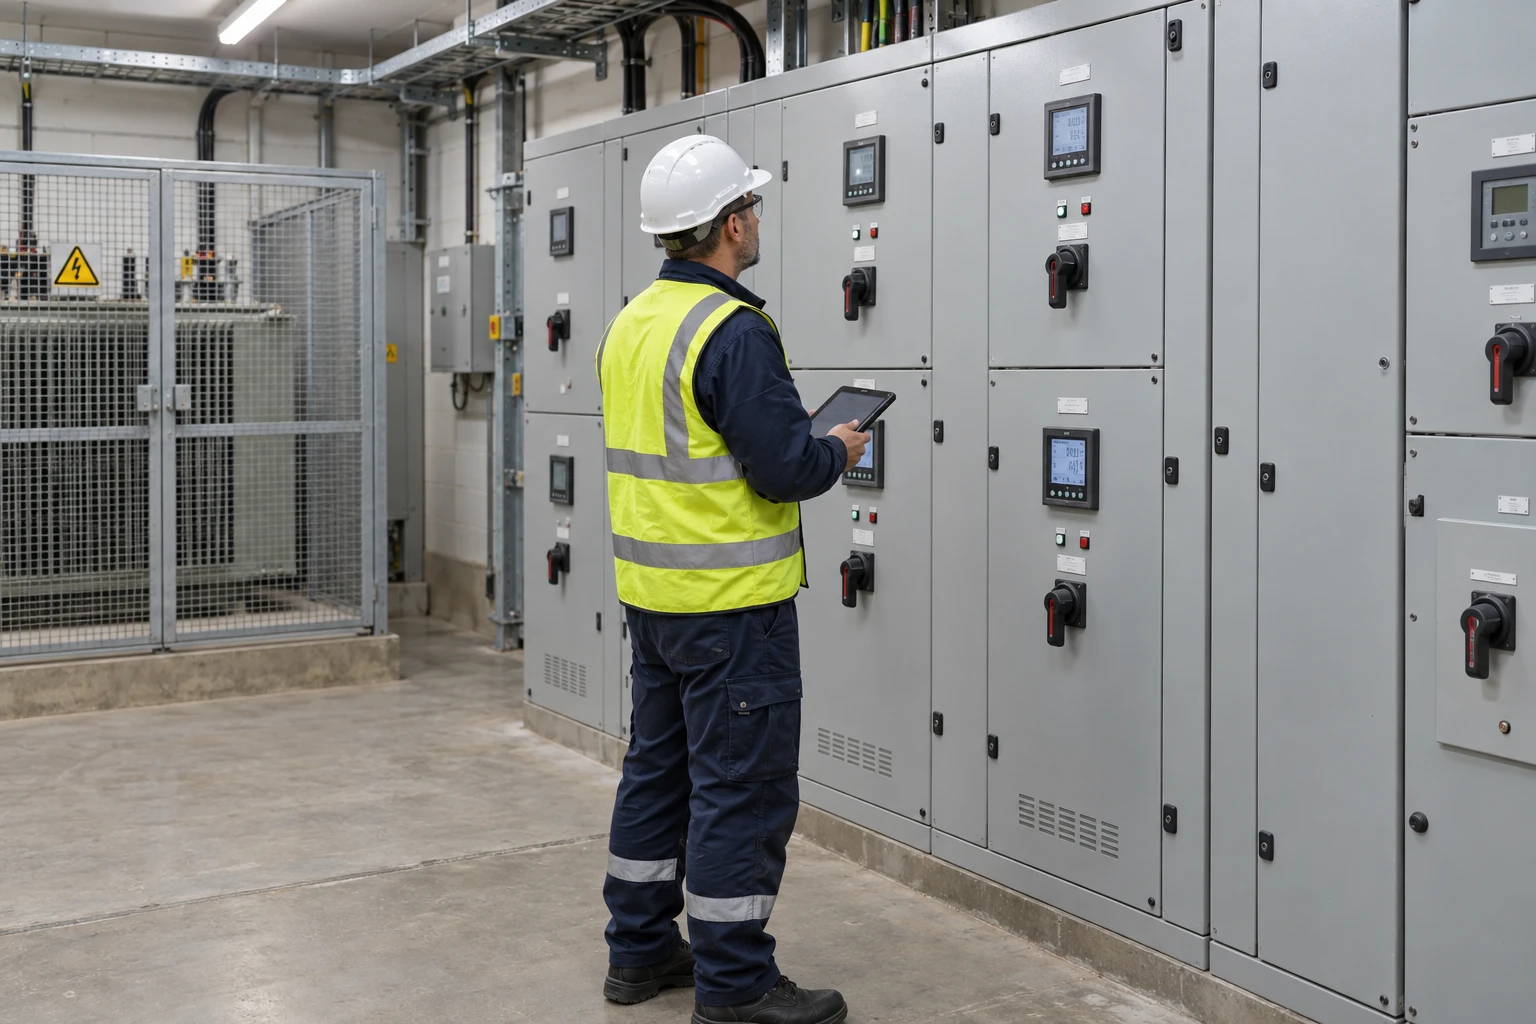
Transformer and distribution board monitoring
A meter at the incomer, meters on the feeders worth explaining, and a temperature probe where loading has to be read against heat. -
Chiller performance monitoring
Cooling output from a flow reading and a matched entering-and-leaving temperature pair, divided by the metered electrical input.


Third-party devices for this application
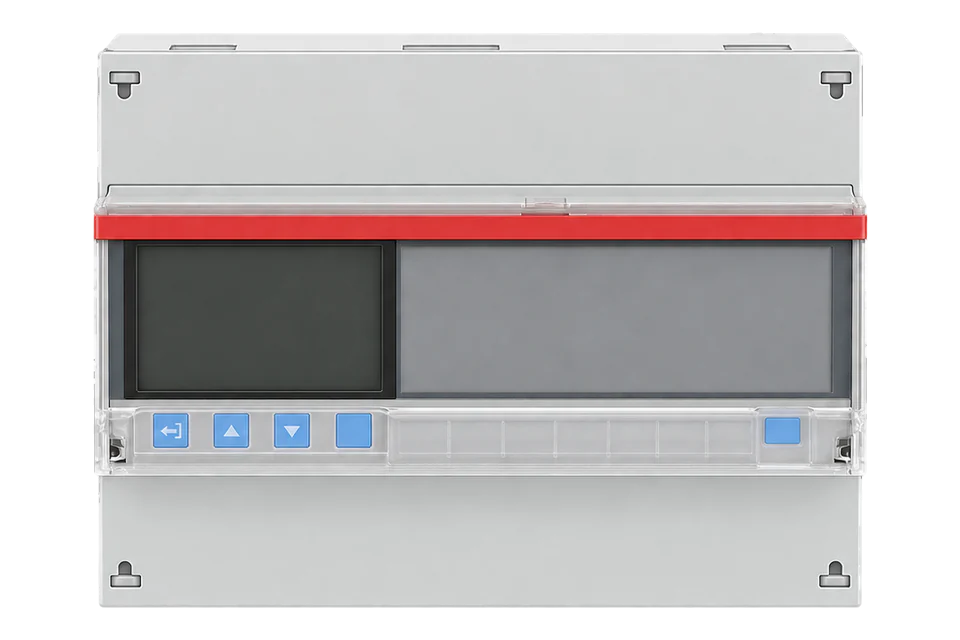
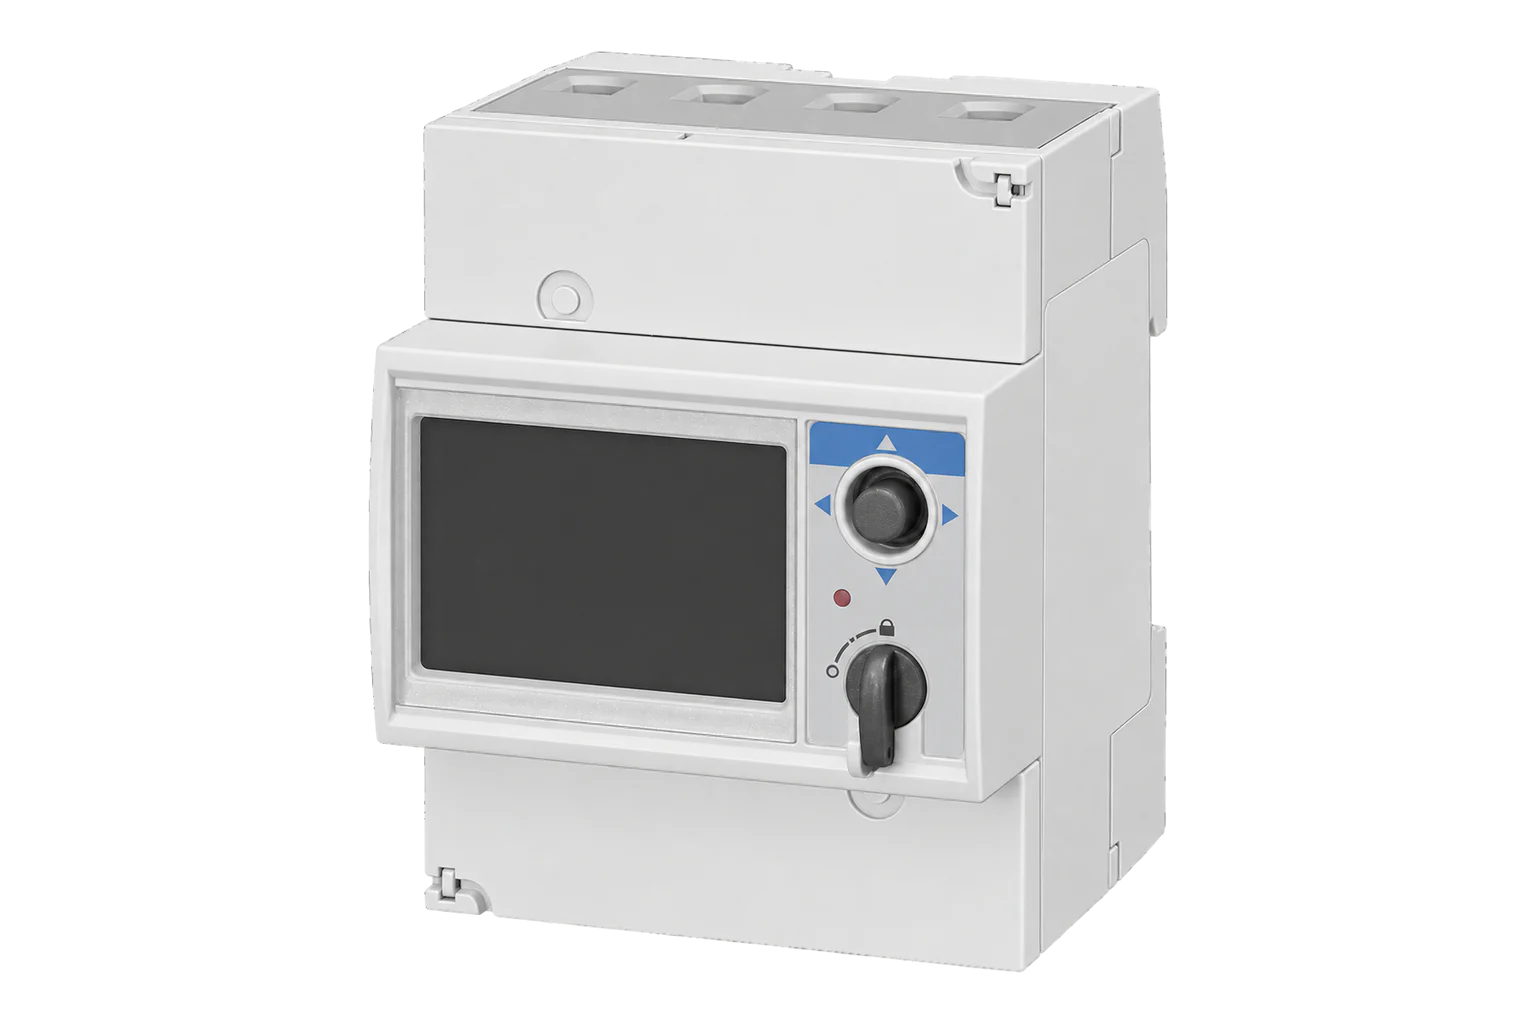
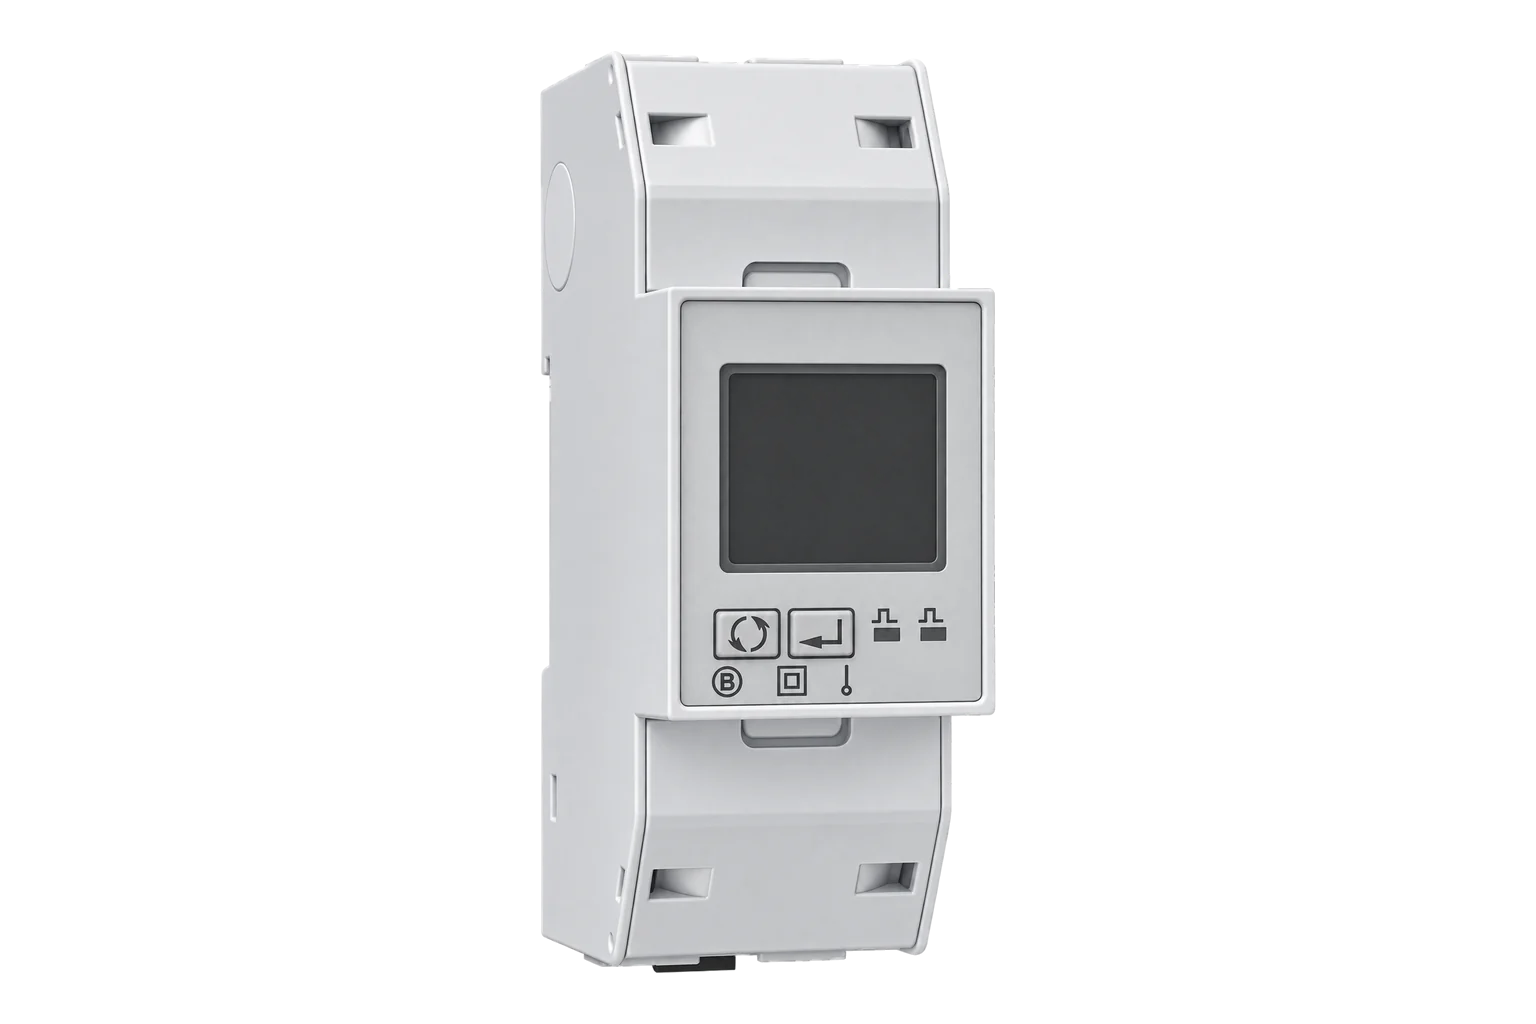
More in the Device Directory: Energy meters (62), Current transformers (7)
Send the single-line diagram and the reporting boundary
Include the UPS and PDU models, register maps, A and B feeds, bypass paths, cooling supplies, existing meters and the decision you need to support. An engineer can then scope the missing measurements and a commissioning plan.