HVAC energy monitoring for commercial buildings
Separate HVAC electricity by supply, see what runs outside the agreed schedule, and choose which heating, cooling, fan or pump system to look at first.
- Measure
- Heating and cooling supplies, air-handling units and circulation pumps
- Good practice
- HVAC submetering needs distinct electrical boundaries and an agreed operating schedule
- Sensors
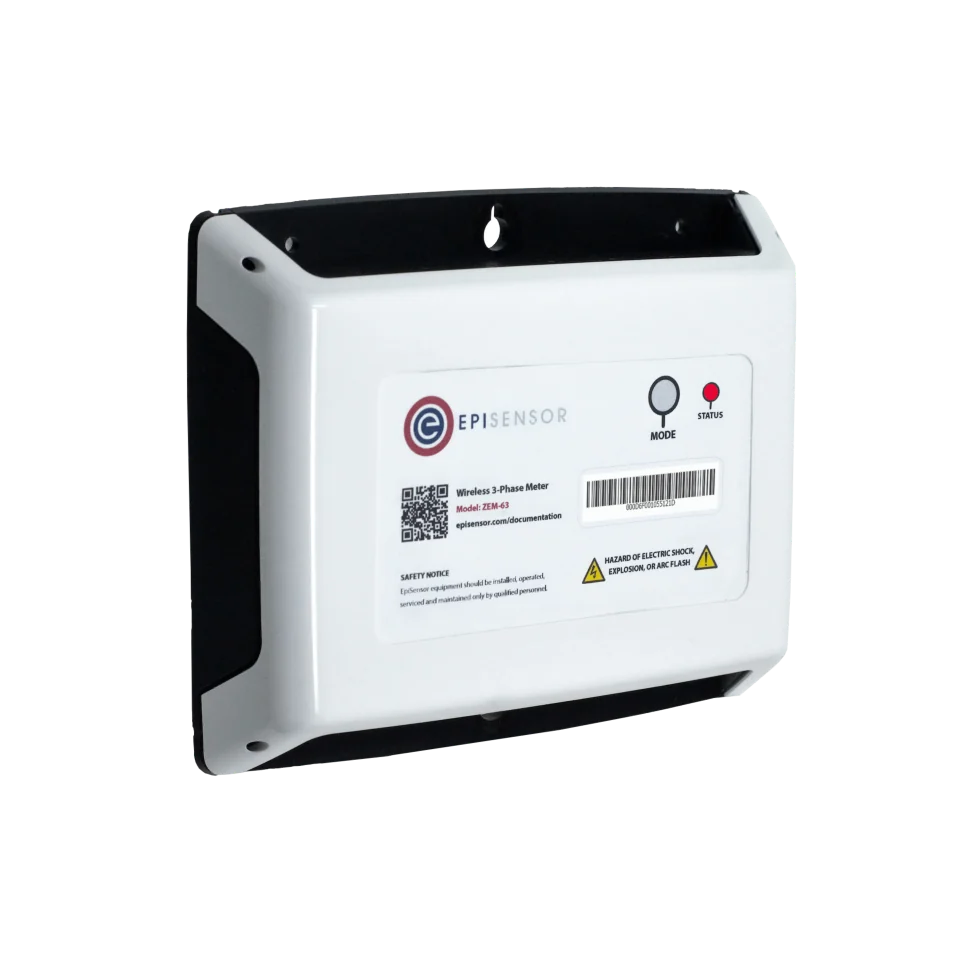
- ZEM-65, electricity meters; optional ZMB-31 for documented controller registers
- On site
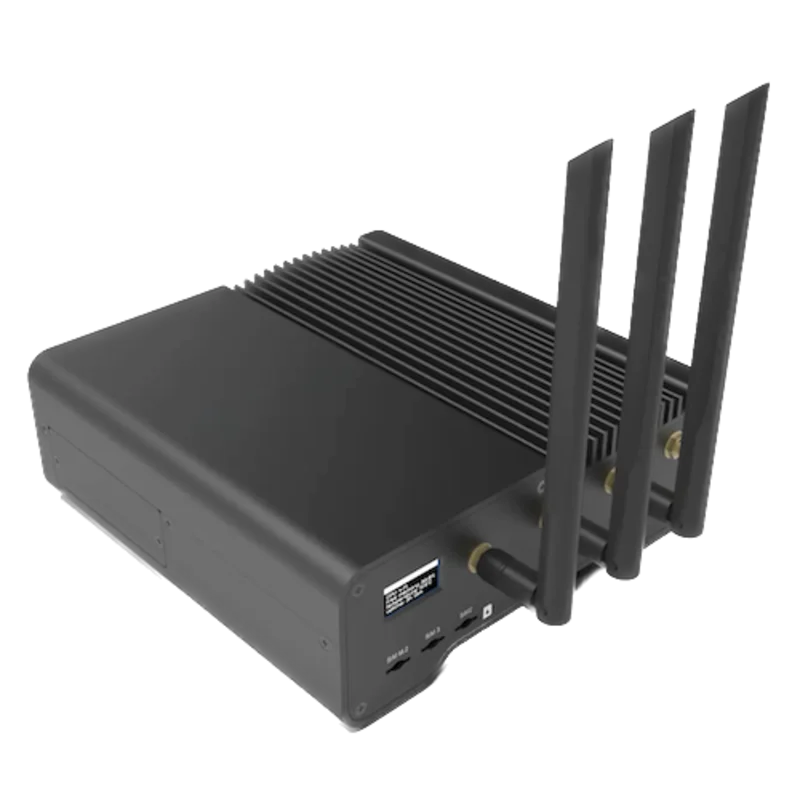
- ZGW-20 Gateway, Edge runs locally; onward platform connection is optional
Start with the HVAC end uses you can separate
A building supply meter cannot tell the facilities team which air handler runs overnight. Map the HVAC feeders and the equipment each serves, then meter the boundaries that answer a maintenance or scheduling question. A shared circuit stays a group measurement. A reversible heat pump has one electrical supply: use a validated operating-mode signal to split its heating and cooling periods, counting each kWh once.
| Buyer decision | Measurement needed | What the result establishes |
|---|---|---|
| Which HVAC loads run outside the schedule? | Separate electricity meters for heating or cooling plant, air handlers and pumps | Consumption by named supply during agreed occupied and unoccupied periods |
| Is a chiller, heat pump or boiler efficient? | Electrical or fuel input plus delivered heating or cooling at the same boundary | An equipment-performance calculation using the linked asset guide; electricity alone is insufficient |
| Can the controls be changed? | Approved control sequence, suitable controller access and an accountable controls engineer | A separate engineering task; this monitoring kit reads the plant and sends it no commands |
Hardware for HVAC electricity monitoring
Count independently metered supplies, then add controller acquisition only where the documented interface and site permissions permit it.
Measures each selected HVAC feeder, including voltage and current rather than estimating energy from current alone
1 per independently metered supply three-phase, 3 or 4 wire
- Choose the CT rating for each supply: 120 A split-core, or 300 A, 1 kA and 3 kA Rogowski coils
Class 0.5S to IEC 62053-22 for the meter and calibrated CTs together, 110 to 480 V line to line
Collects named HVAC readings and keeps local histories and configured rules
1 per surveyed coverage area coverage and capacity checked for the actual building
If the controller has documented registers and the segment allows this master
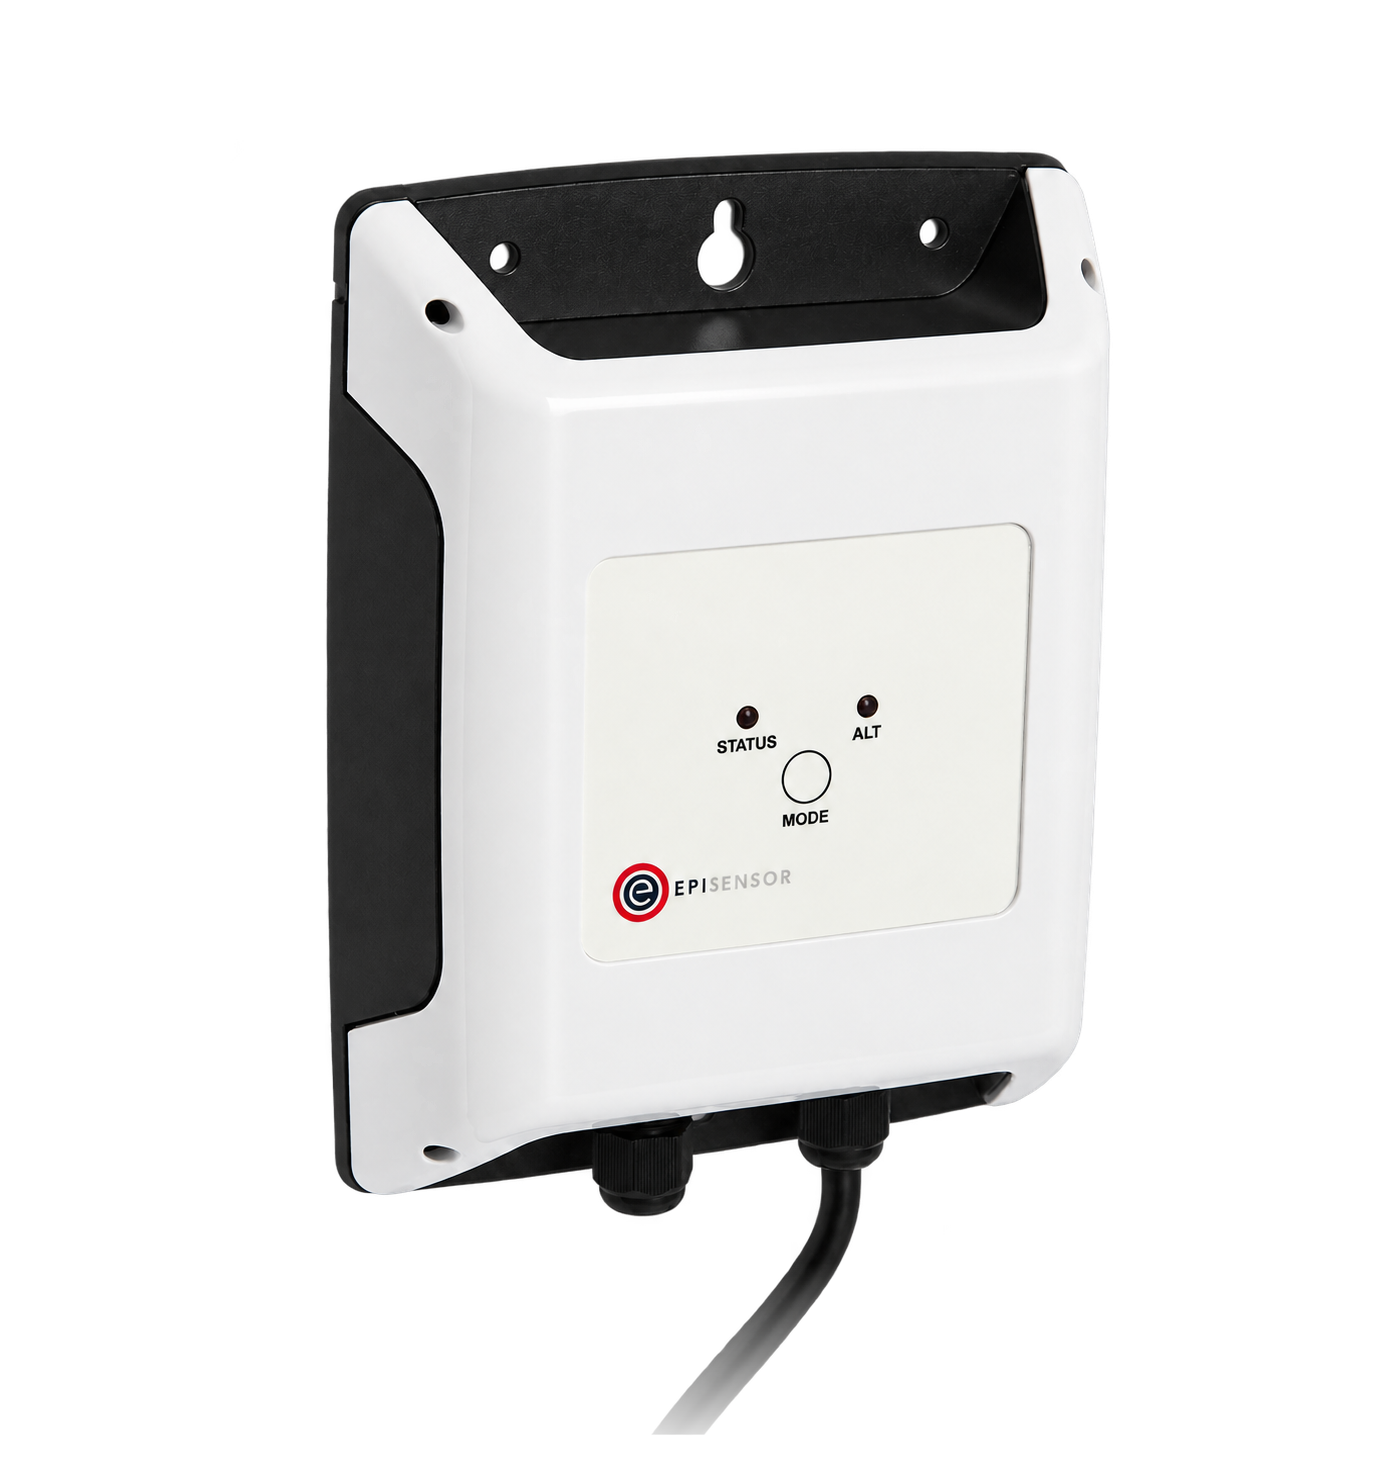
Reads supported operating mode, run state and temperature registers from the existing HVAC controller
1 per suitable RS-485 segment up to 30 configured registers
Modbus RTU master over RS-485, mains powered
Keep heating, cooling and air movement identifiable
Build the point list around the electrical drawing, plant schedule and the question each reading answers. Keep electric input, fuel input and delivered heat as different quantities.
From HVAC feeders to a local operating record
Electricity meters identify the supplies. A separate, optional Modbus path adds controller context. Both report through the Gateway to Edge.
- Wired
- Zigbee
- Edge
- Platforms
| Position | What it tells you | Reference | Sensor |
|---|---|---|---|
| Heating and cooling electricity | kW demand and cumulative kWh at each plant supply | Record the auxiliary heaters and packaged pumps inside the feeder, and count them once, as part of it | ZEM-65 (on this page) |
| Air-handling electricity | Consumption and start and stop patterns by AHU | If fans, reheat and other auxiliaries share the supply, name the value as AHU electricity rather than fan-only electricity | ZEM-65 (on this page) |
| Circulation-pump electricity | Whether the distribution circuit draws power during selected periods | Electrical input only: water flow, head and pump efficiency need their own measurements | ZEM-65 (on this page) |
| Controller operating context | Heating or cooling mode, run state and temperatures where the exact controller exposes them | Verify register meaning, units and timestamp against the controller; confirm running from a status point or current, since a command or enable flag only shows the request Modbus Interface datasheet | ZMB-31 (on this page), optional |
Get the occupied schedule from the site team. Obtain opening hours, holidays, cleaning periods and permitted warm-up or setback operation from the site team, and record the time zone and daylight-saving treatment. The occupied windows come from the site, not from the meter data.
Meter gas heating at the fuel meter. A boiler's electrical supply normally measures its auxiliaries; its gas input is a separate fuel-meter path, covered in the boiler performance guide.
Read energy against outside temperature. Use suitable outside-air and representative zone readings when they are available. A lower weekly kWh total may reflect milder weather or shorter occupancy, and delivered heat needs flow as well as temperatures.
Use HVAC trends to choose the next investigation
Keep raw meter readings in Edge and review aligned periods with the site schedule. More detailed portfolio or weather analysis can use a separately configured receiving platform.
- A worked schedule comparison
- For the illustrative four-supply office, agree 15-minute analysis intervals, keep source timestamps and calculate kWh from valid cumulative-register differences. Suppose one complete week totals 1,200 kWh across the four separate supplies, with 300 kWh outside the agreed occupied windows. The outside-hours share is 300 ÷ 1,200 = 25%: the share to investigate first, before any saving is estimated.
- Check start-up and shutdown together
- Compare AHU and pump power trends with permitted start-up, shutdown and frost-protection periods. Confirm any apparent overnight run with the responsible operator before changing a schedule.
- Investigate apparent heating and cooling overlap
- Use separate plant meters and validated mode and status points to locate overlapping operation. Different zones, dehumidification or heat recovery may explain it, so confirm simultaneous heating and cooling from the mode points before calling it a controls fault.
- Keep missing data visible
- Configure and test a no-data rule for each required input. Exclude incomplete intervals from comparisons and report the missing coverage. A stale mode flag is stale and a missing electricity reading is a gap: neither is current, and neither is zero.
Commissioning checks
Commission the electrical boundaries first, then validate the context used to interpret them.
-
Match each meter to a feeder
Have a competent electrical installer confirm the circuit, voltage connections, CT selection and orientation under an approved installation procedure. Observe an authorised load change.
Pass when the named feeder responds on the expected meter, phase readings are plausible and the included equipment is recorded.
-
Read the controller without disturbing its bus
Check the register map, serial settings, address, data type, scale and existing master arrangement. Compare a mode change and temperature with the controller display using read-only acquisition.
Pass when the readings match, Edge polls through its own port or bus rather than as a second master beside the BMS, and every Edge point is read-only.
-
Agree the calendar and clock
Record occupied windows, exceptions, warm-up and protection periods. Compare meter and controller timestamps and verify the local-time conversion across a daylight-saving transition.
Pass when one documented schedule and time basis classify every analysis interval consistently.
-
Reconcile one complete period
Calculate each feeder's cumulative kWh change over identical start and end times, check resets or gaps, then sum only non-overlapping supplies and classify their intervals against the schedule.
Pass when occupied plus outside-hours energy equals the complete-period total, and the raw readings reproduce the reported share.
-
Test loss of a measurement path
Use an approved communications test to interrupt one reporting path without interrupting plant control, then restore it.
Pass when the no-data condition reaches the agreed recipient and missing intervals stay distinguishable from zero load.
Limits of this measurement
The first result is an operating record with named boundaries. Further conclusions need additional evidence.
- Outside-hours electricity is not automatically waste: warm-up, ventilation requirements, frost protection and critical spaces can justify operation.
- This kit does not establish chiller COP, heat-pump seasonal performance or boiler efficiency; these require matched output and input measurements under the linked asset-specific methods.
- Monitoring does not replace the BMS, optimise setpoints automatically or certify ventilation, indoor air quality or occupant comfort.
- A shared feeder cannot separate its connected loads in software. Unmetered electric reheat, gas or district heat remains outside the reported electrical total.
- Savings need a defensible comparison with weather, occupancy, service conditions and data coverage considered. No savings percentage follows from the illustrative example.
Sources
- Screening a Building for Re-tuning Potential (opens in a new tab) (opens in a new tab) U.S. Department of Energy FEMP
- Heating, ventilation and air conditioning (opens in a new tab) The Carbon Trust
- Wireless 3-Phase Electricity Monitor datasheet (opens in a new tab) EpiSensor. Specifications, ranges and ordering codes.
Related
-
Chiller performance monitoring
Cooling output from a flow reading and a matched entering-and-leaving temperature pair, divided by the metered electrical input. -

Heat pump performance monitoring
Read the heat meter over M-Bus, meter every electrical input, and compare COP over complete periods. -
Boiler performance monitoring
A pulse counter on the fuel meter coming in, a heat meter on the way out, and the firing state that tells you which periods are worth comparing.


Third-party devices for this application
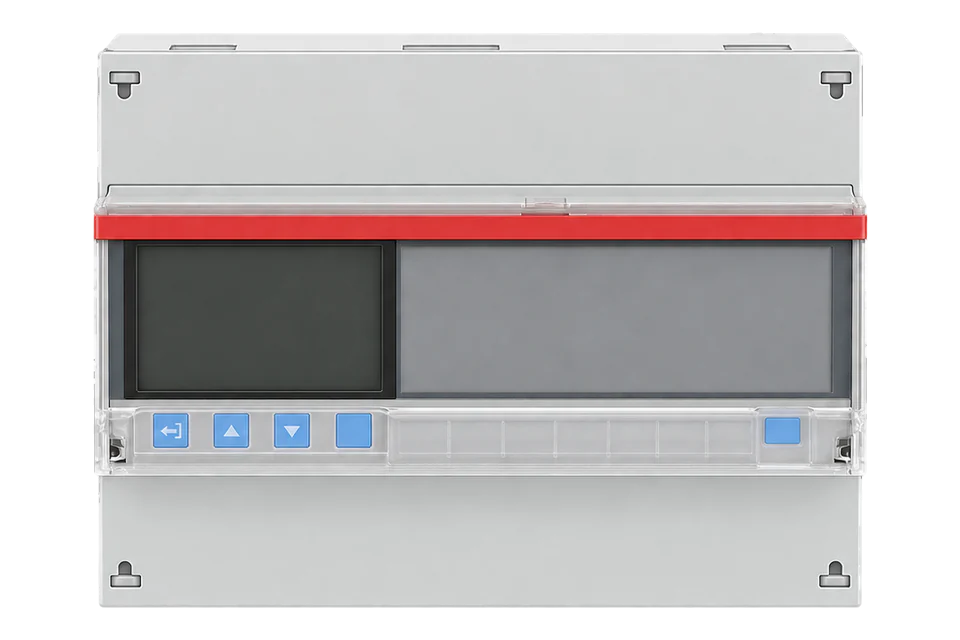
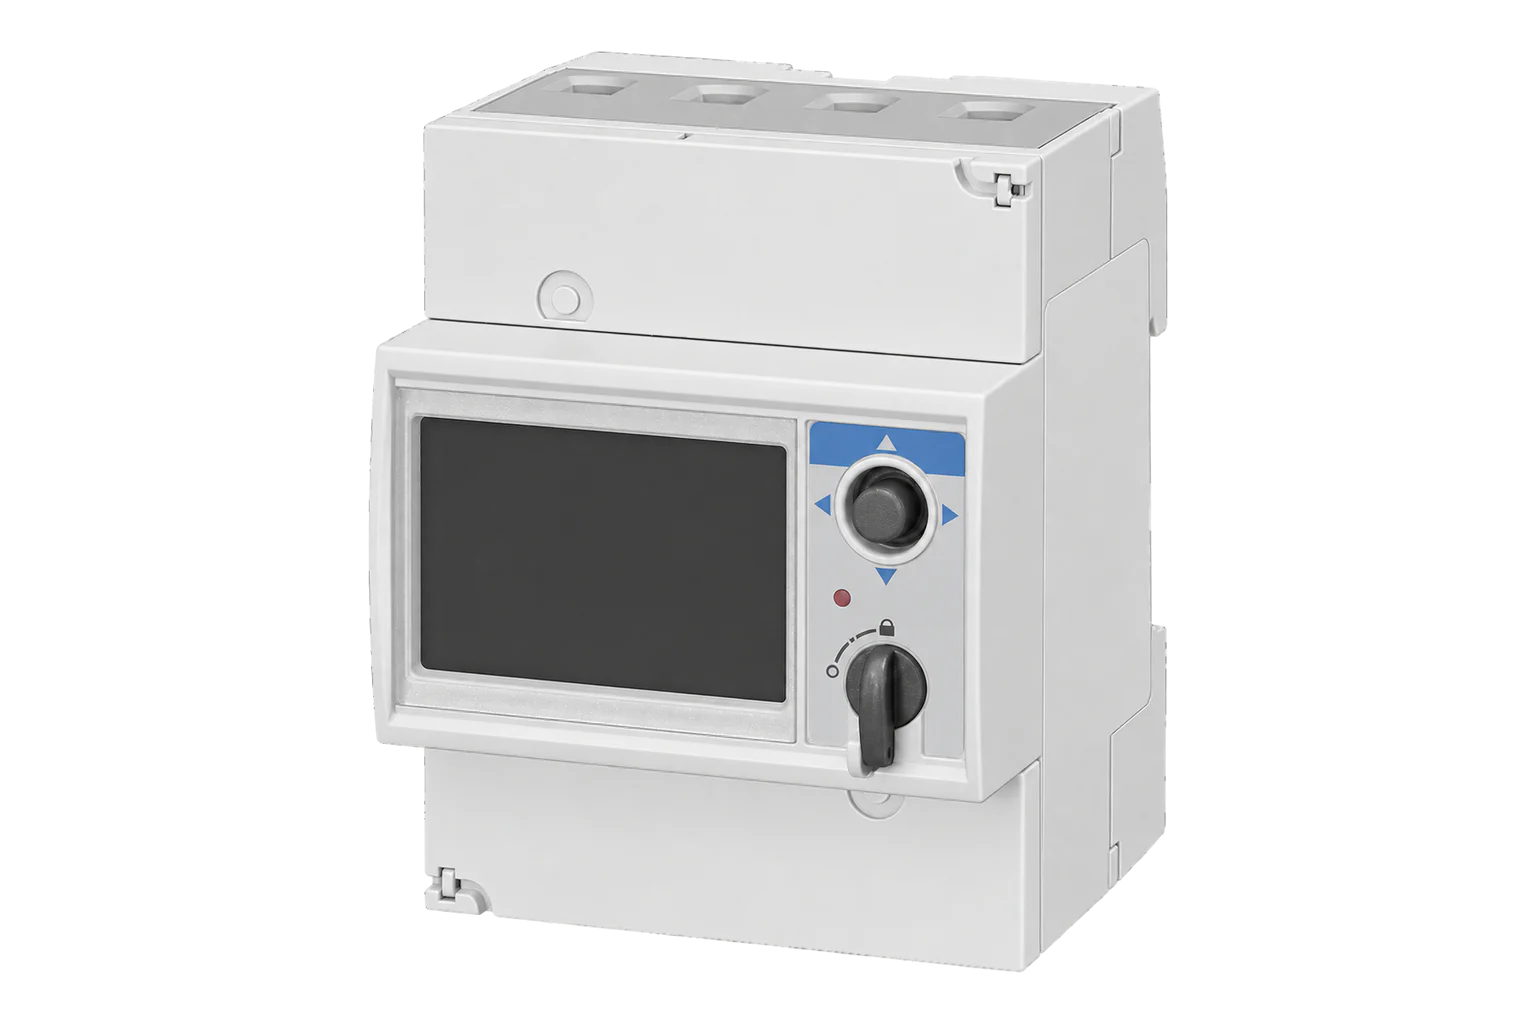
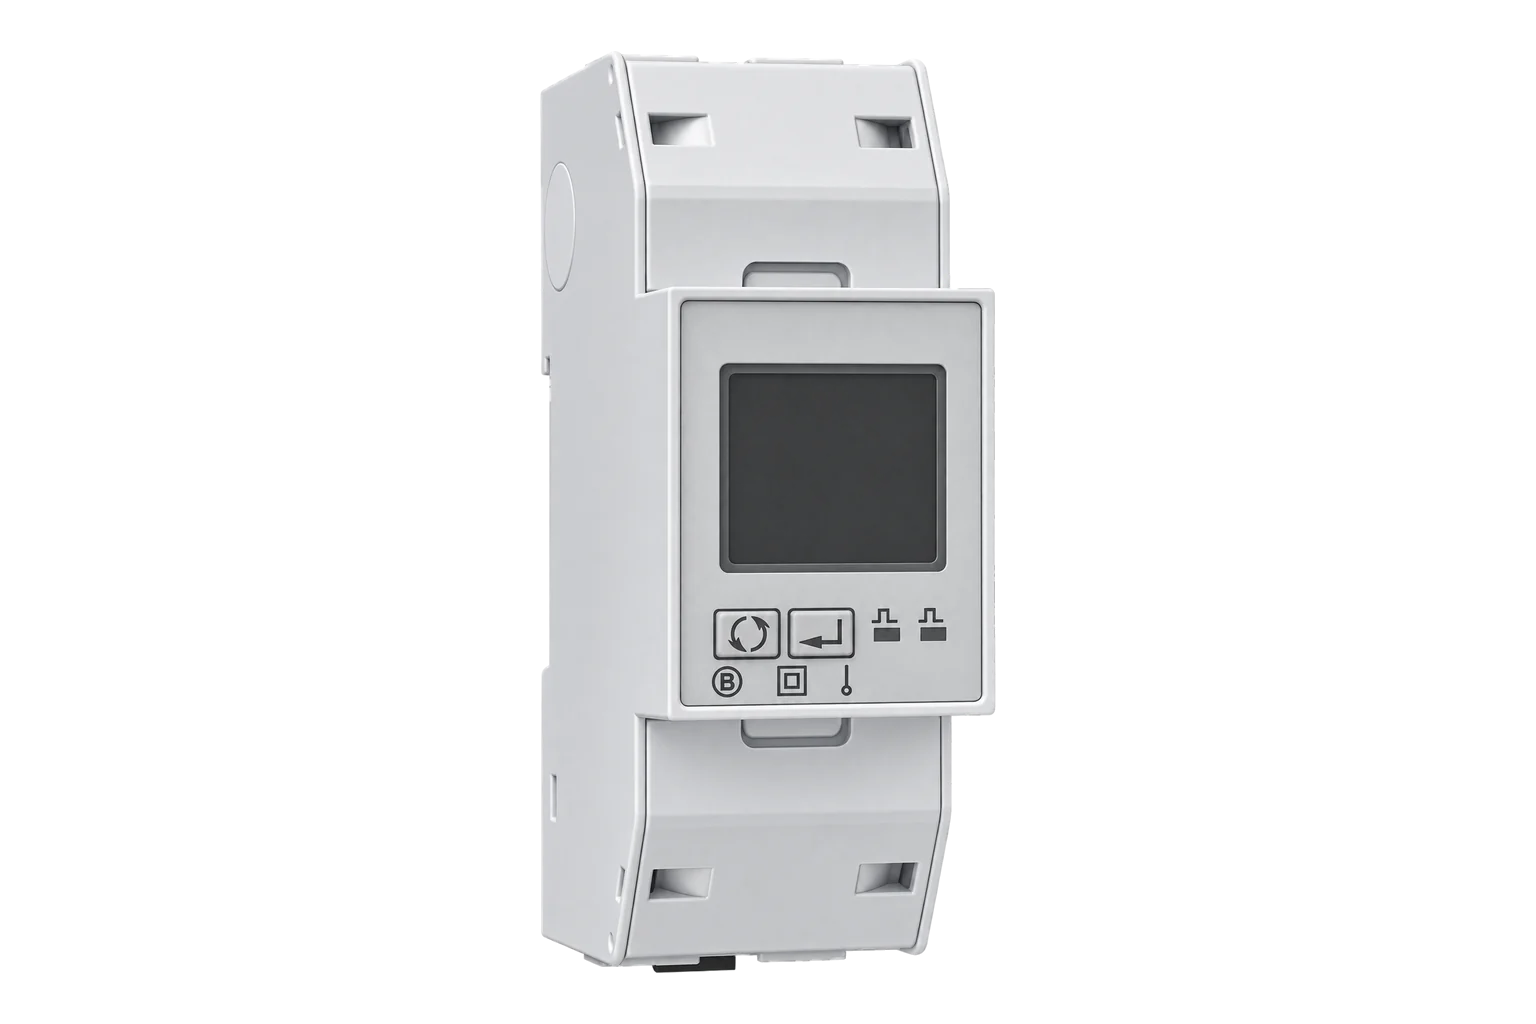
More in the Device Directory: Energy meters (62), Current transformers (7)
Send the HVAC feeder list and operating schedule
Include the equipment served by each supply, CT access and ratings, the controller model and register map if available, and the question the team needs to answer. An engineer can then scope the metering and commissioning work.