EpiSensor Edge: local monitoring,
data and automation

The complete Edge application: the site and its buildings in the navigation, and a cold chain dashboard holding zone heating setpoints for three areas, three active alerts, a gauge and a live reading for the chill and freezer stores, a plan of the ground floor reading the temperature of the rooms that have a sensor in them, and seven days of both cold stores on one chart.
A cold chain dashboard: zone setpoints, open alerts and a floor plan reading each room.

Where Edge runs

Edge runs on site, on an EpiSensor Gateway or on your own server. It records readings and runs automation there, so the site keeps working when the internet connection does not.

EpiSensor Edge
Platform
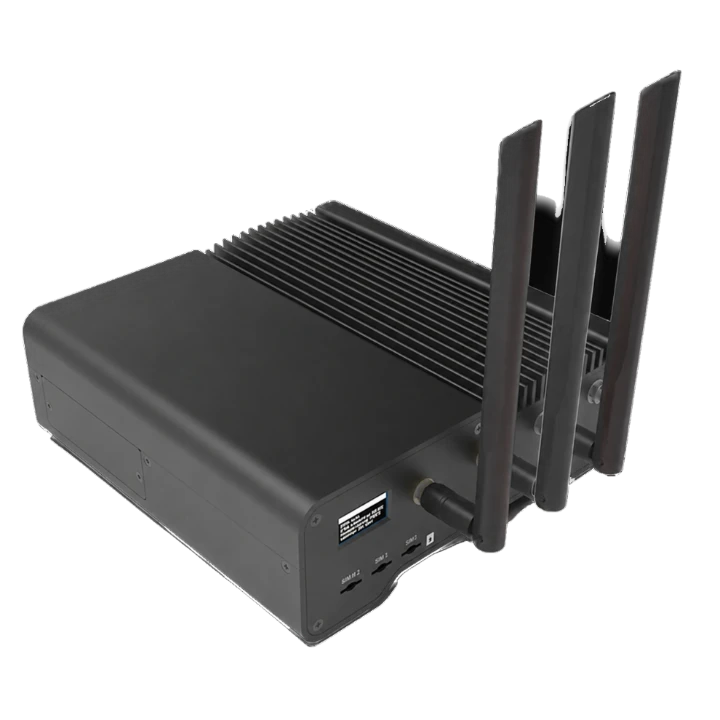
EpiSensor Gateway
Zigbee
Modbus
ZEM
ZDR
EpiSensor Zigbee devices
Third-party Zigbee devices
HVAC
Solar PV
Heat pumps
Battery storage
Meters
ZPC
BACnet
LoRaWAN
LoRaWAN devices
ZEM
Core
Retrofit friendly. No new wiring.
Kilometres of range, years on one battery.
Get rich data from legacy meters
Open APIs. Any platform.
Bring your own data SIM.
Wireless sensors and wired equipment connect to the Gateway. Edge runs locally on it.
  1. Runs on

    EpiSensor Gateway

    Ubuntu Core, with Edge installed.

    Gateway

    Your server or virtual machine

    Ubuntu Server on amd64 or arm64, down to a Raspberry Pi.

    Download System Manager
  2. On site

    Edge

    • Records readings to local history
    • Runs automation and calculations
    • Serves dashboards and the API
  3. Use it from

    • A browserAny browser that can reach the Gateway
    • System ManagerThe desktop app for macOS, Windows and Linux
    • The mobile appiPhone and Android
    Download System Manager

Keeps running without the internet

Recording readings, automation rules, calculations, and dashboards and apps on the site network.

Needs a connection

Remote access, external notifications and connected platforms.

The Edge mobile app

Sign in with your Gateway user to see rooms, devices, charts, rules, alerts and settings.

  • iPhone
  • Android
  • Sign in with your Gateway user, as in the browser

The app is issued with Edge access. Talk to an engineer to get it.

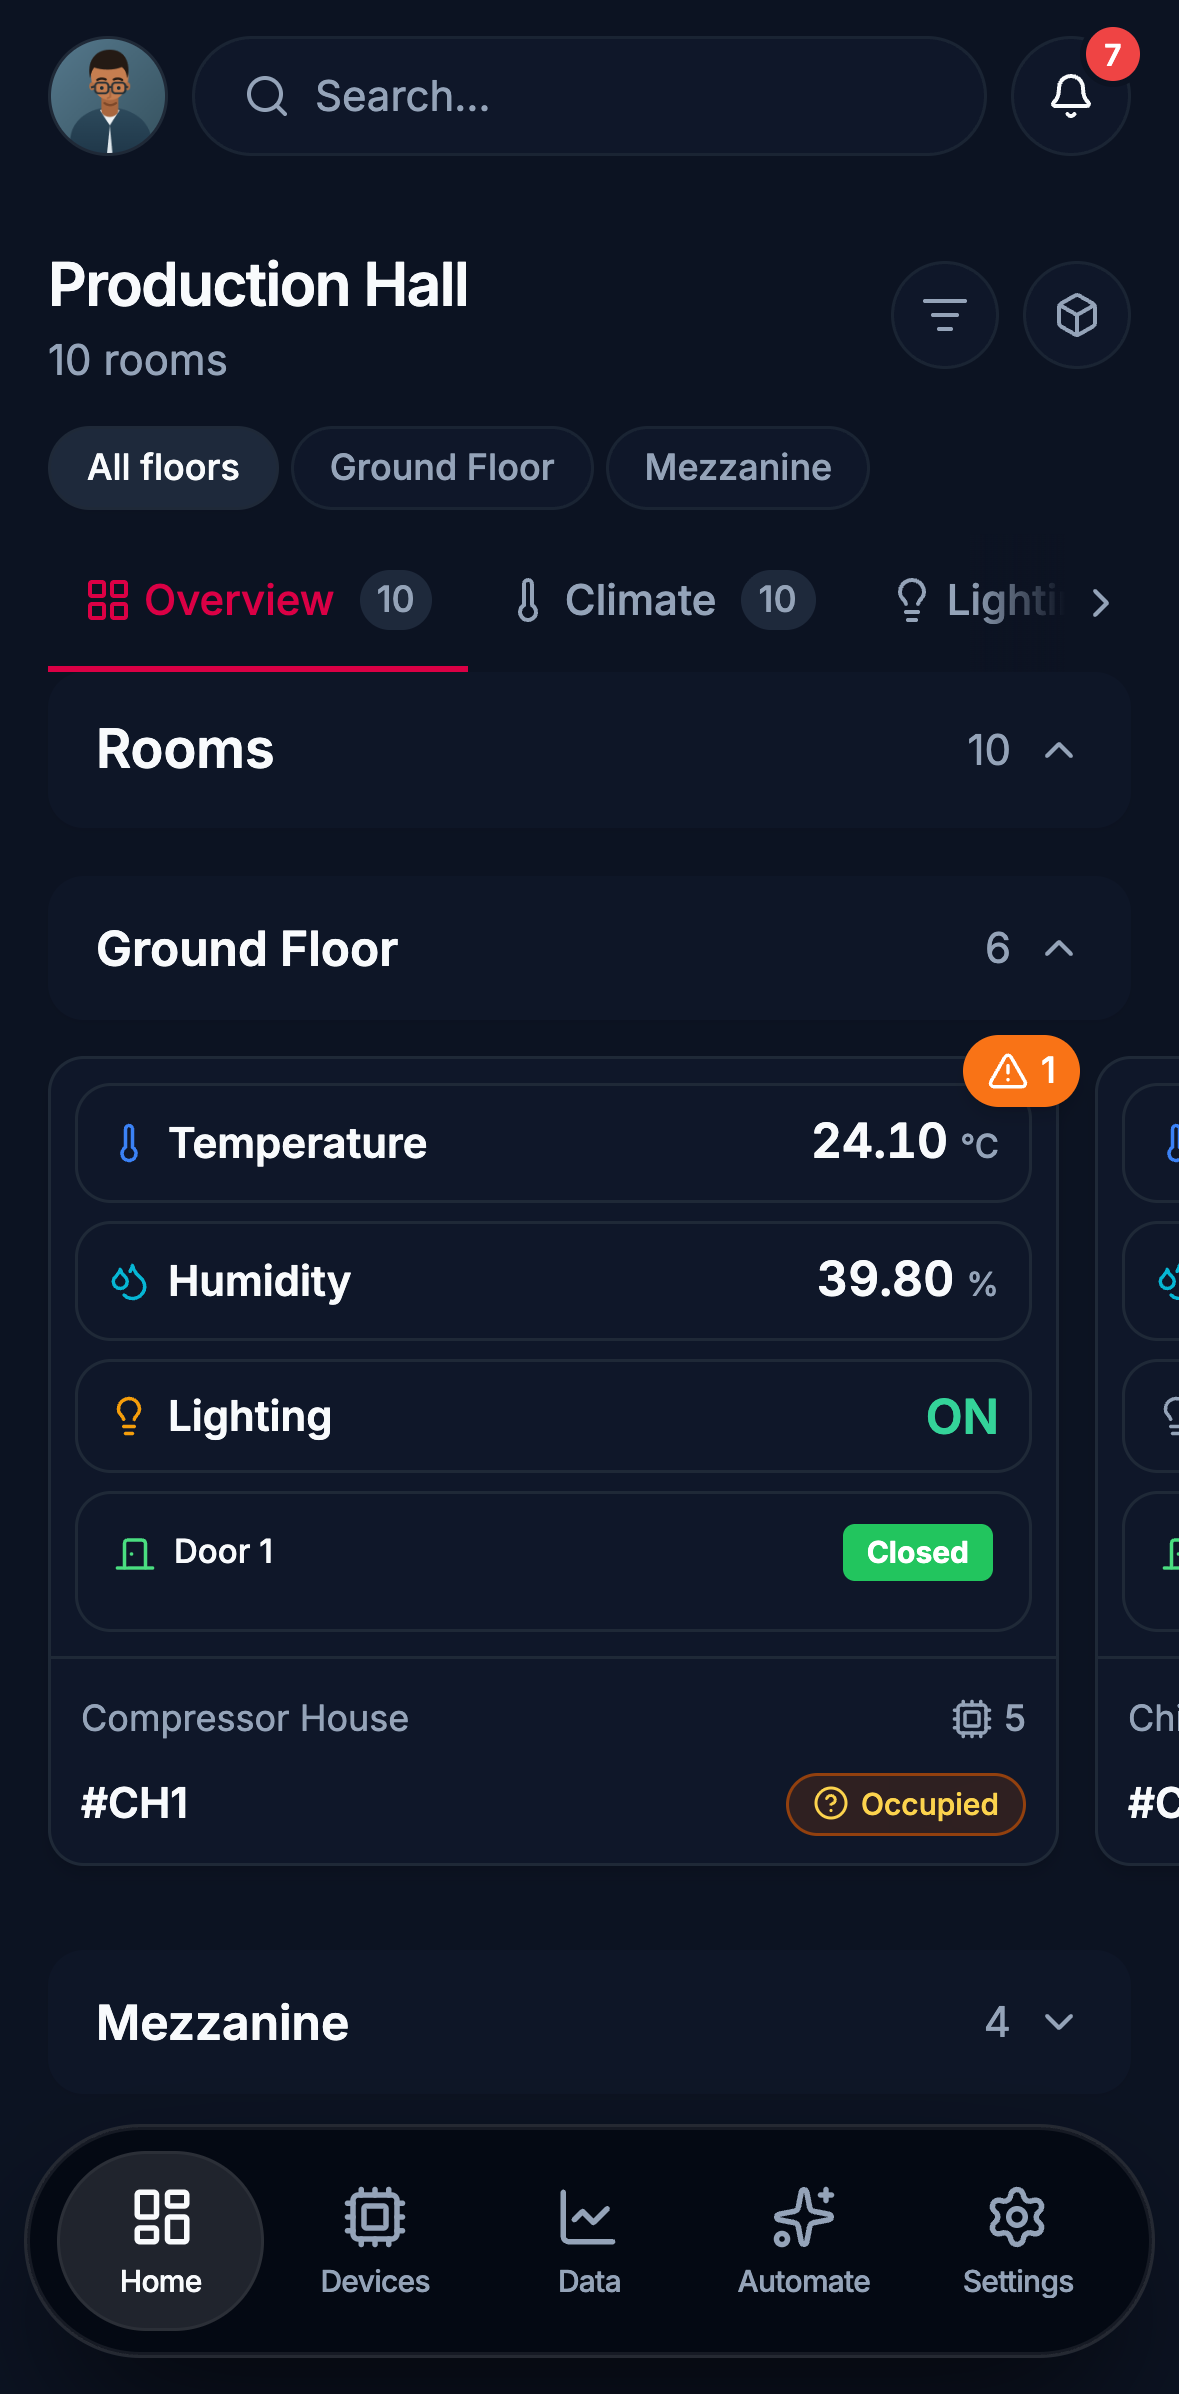
Edge on a phone: the Production Hall home screen, its ground floor rooms with live temperature, humidity, lighting and door state, the mezzanine collapsed below them, and navigation for Home, Devices, Data, Automate and Settings.
Home Every floor of the building, and what each room is reporting now.
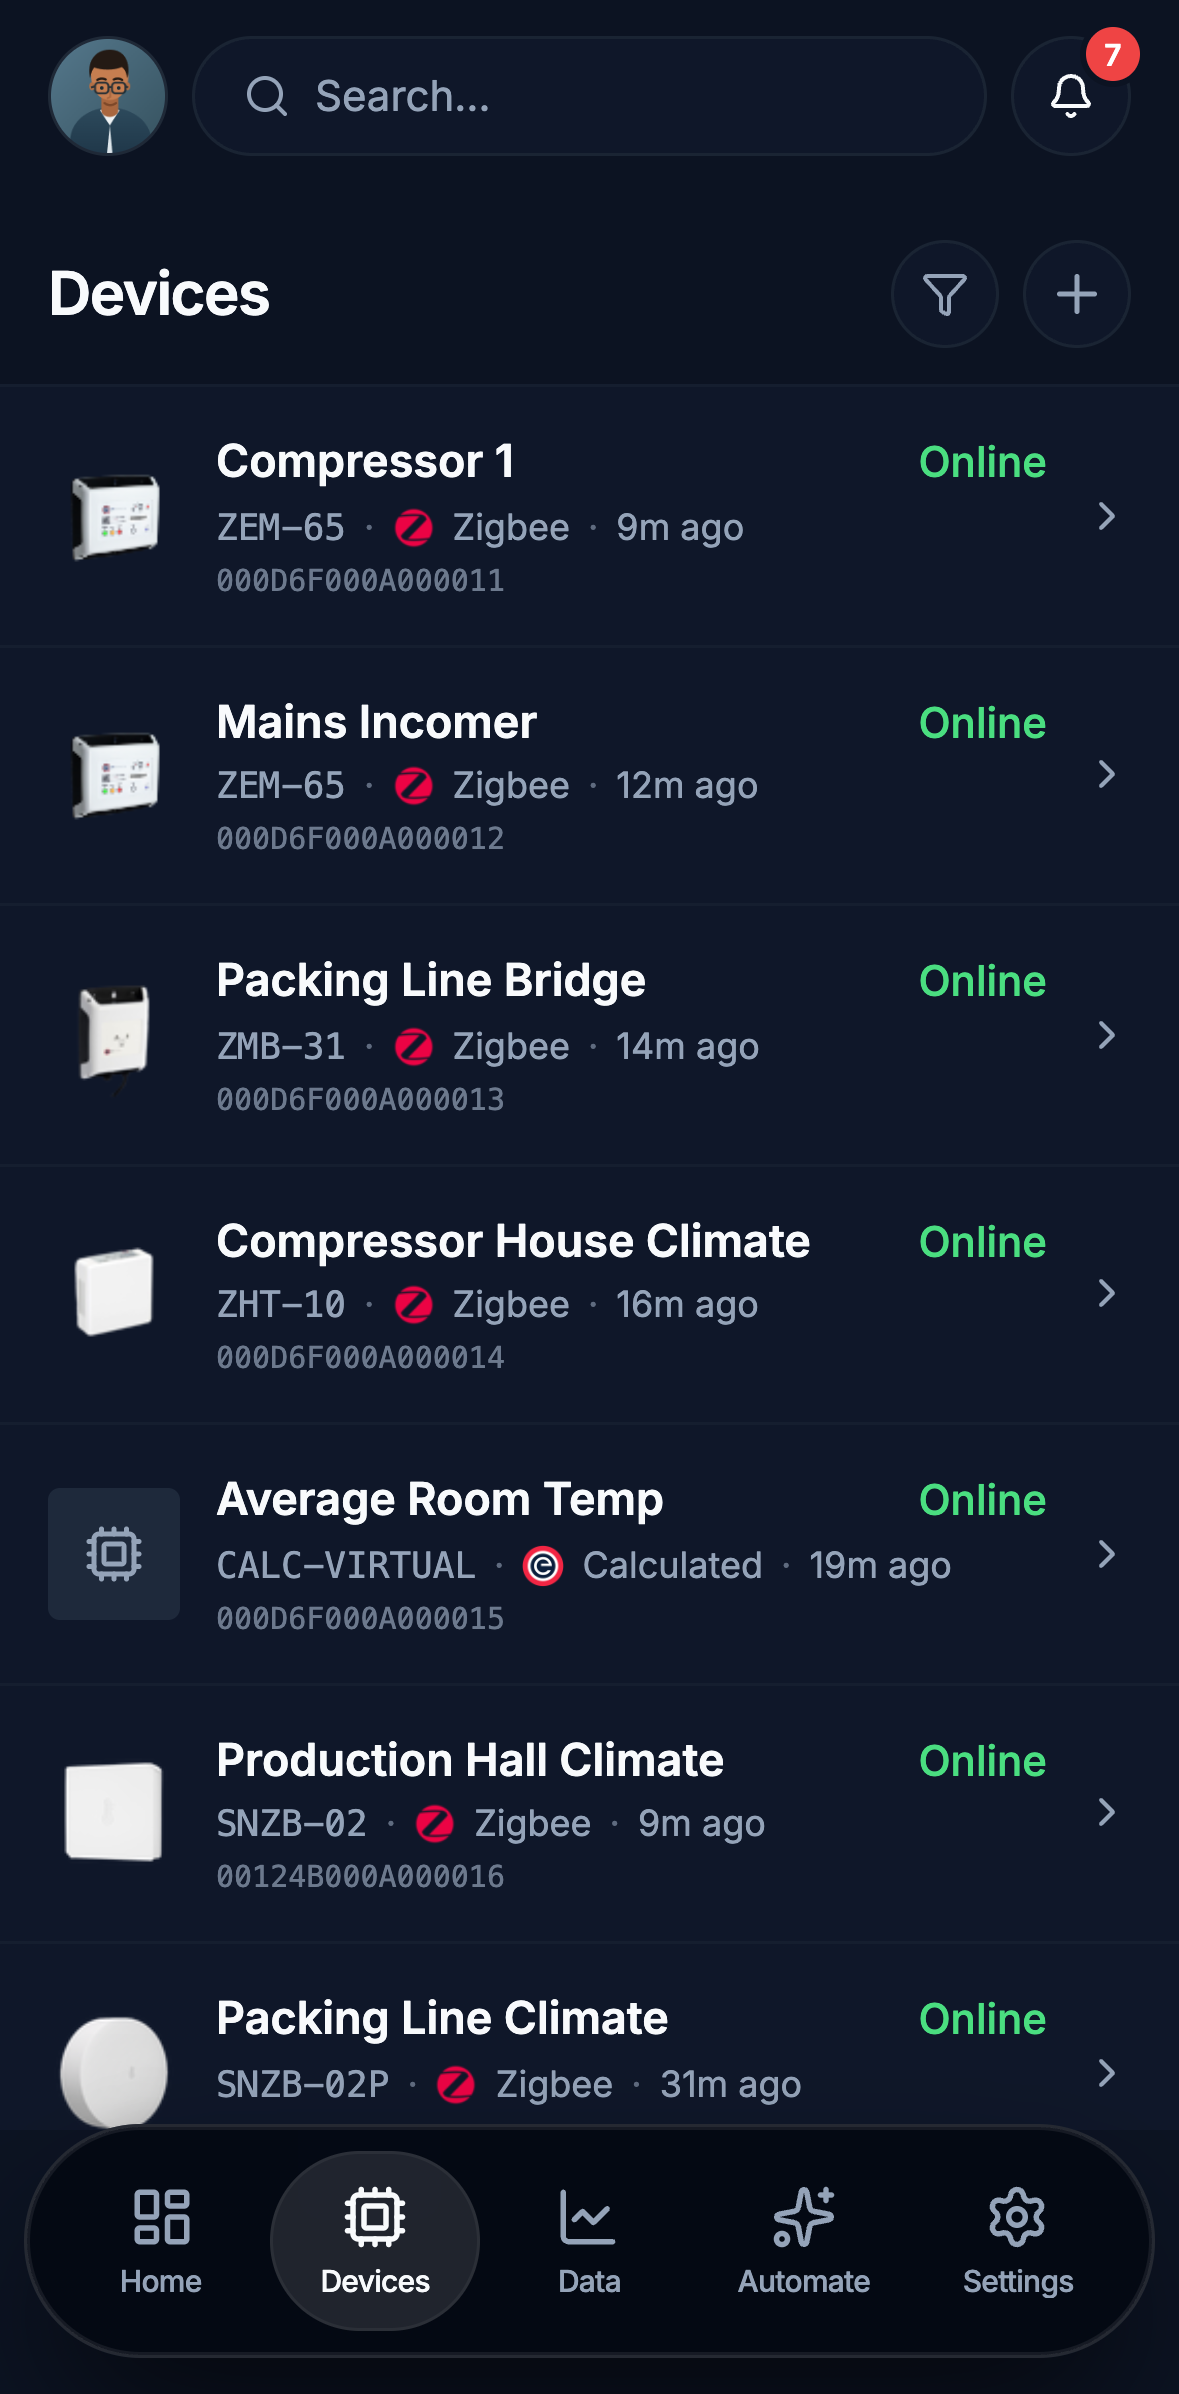
Edge on a phone: the device list, each row with the device name, its model and protocol, when it last reported and whether it is online. Electricity monitors, a Modbus bridge, climate sensors and a calculated device.
Devices Every device on the Gateway: model, protocol, whether it is online and when it last reported.
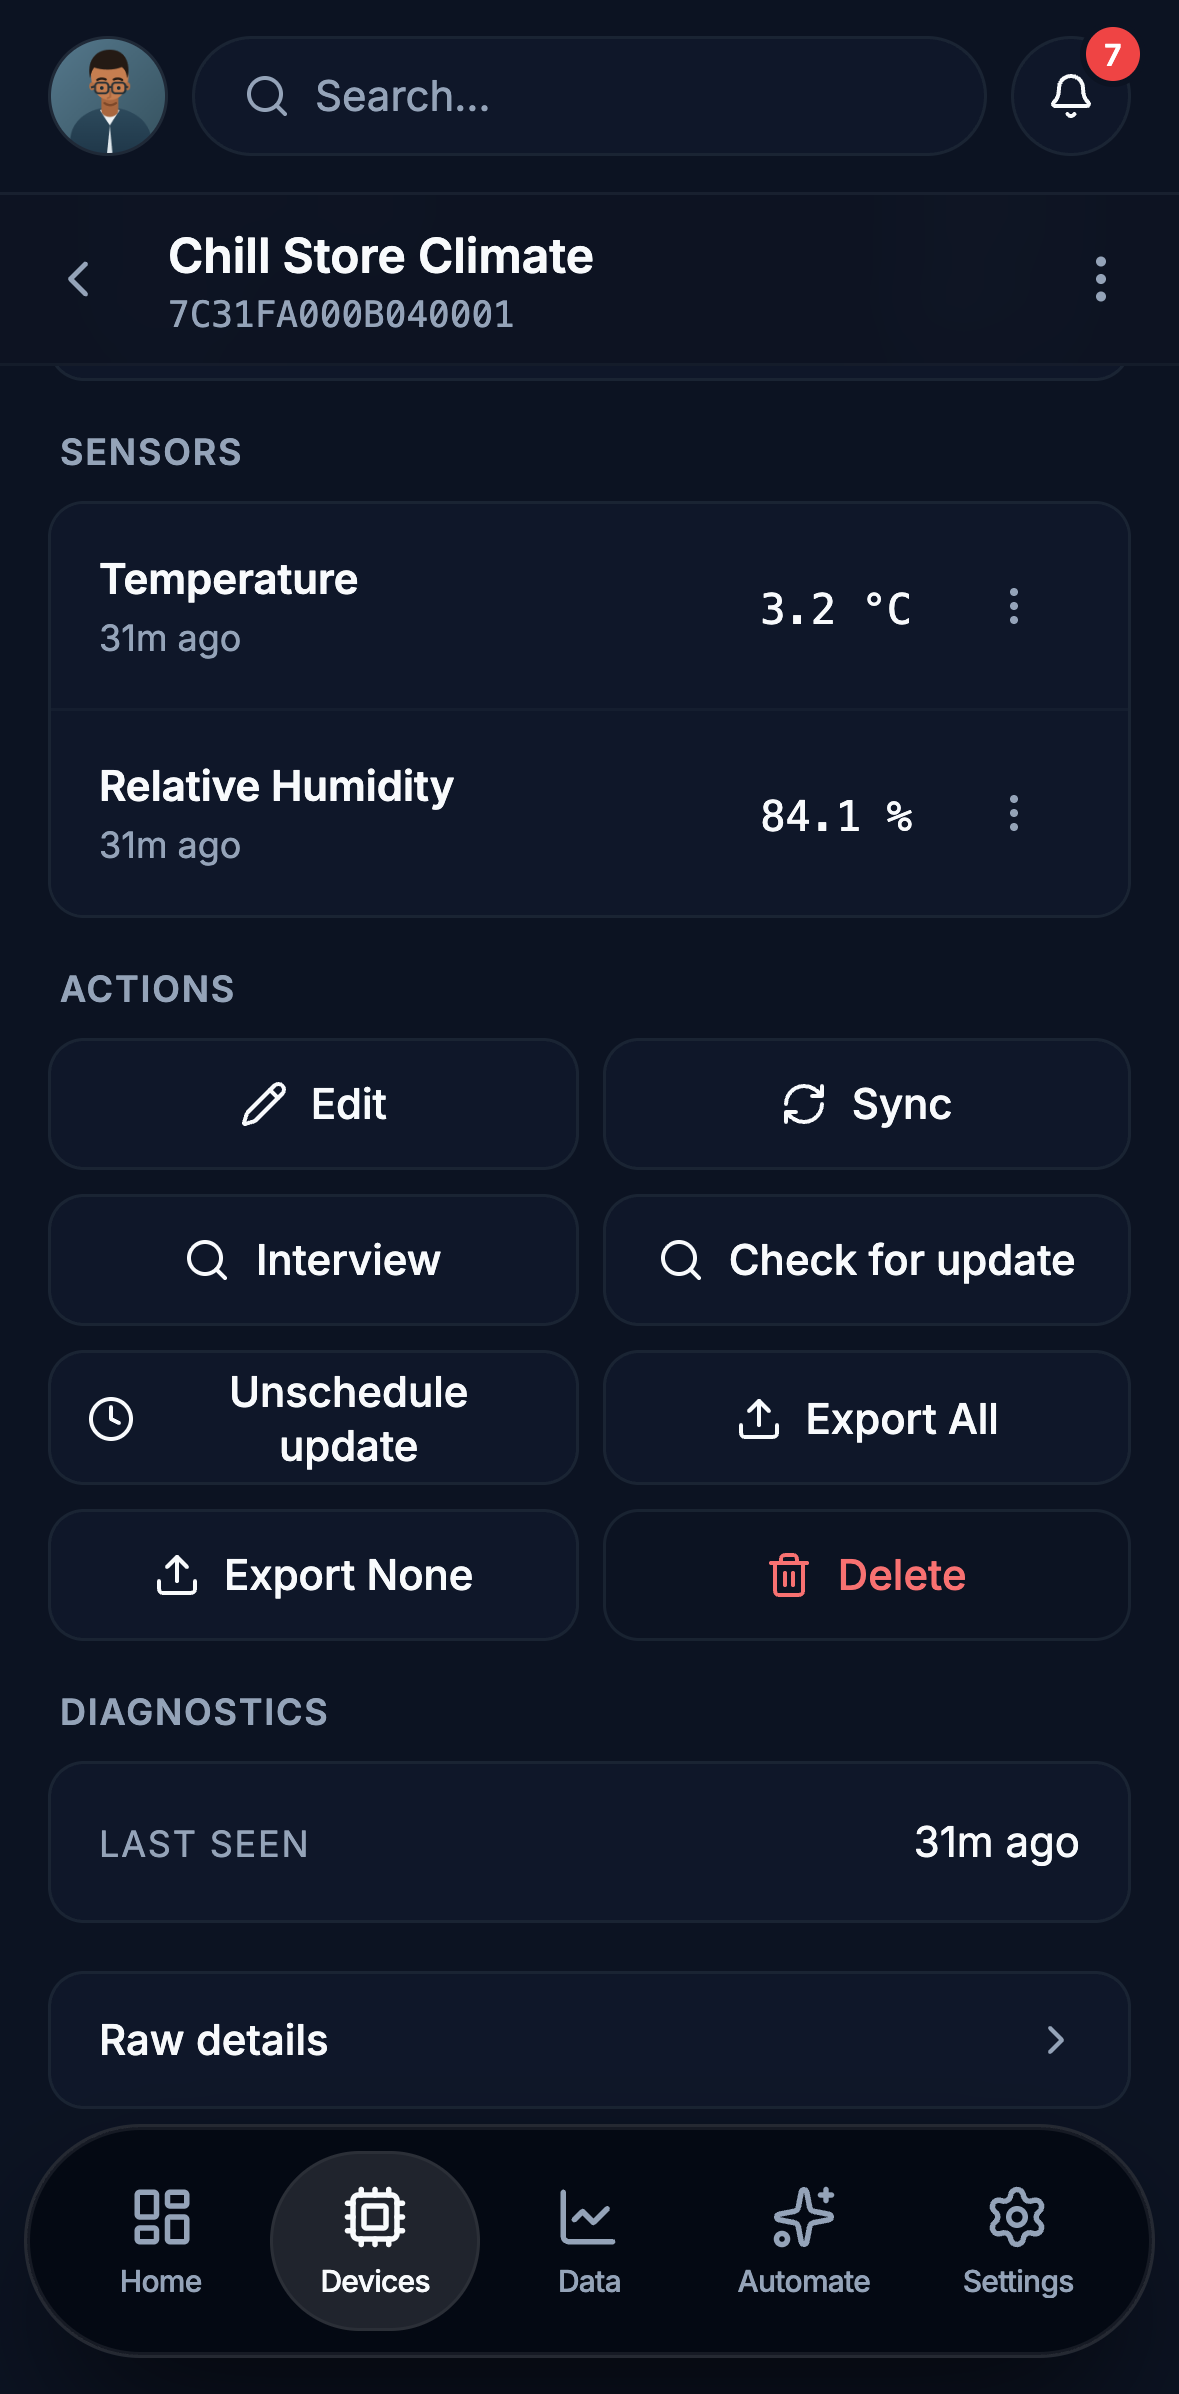
Edge on a phone: one climate sensor, with its temperature and humidity readings, actions to edit, sync, interview, check for a firmware update, export and delete, and its diagnostics below them.
One device Its identity, its live sensors and the commands it accepts.
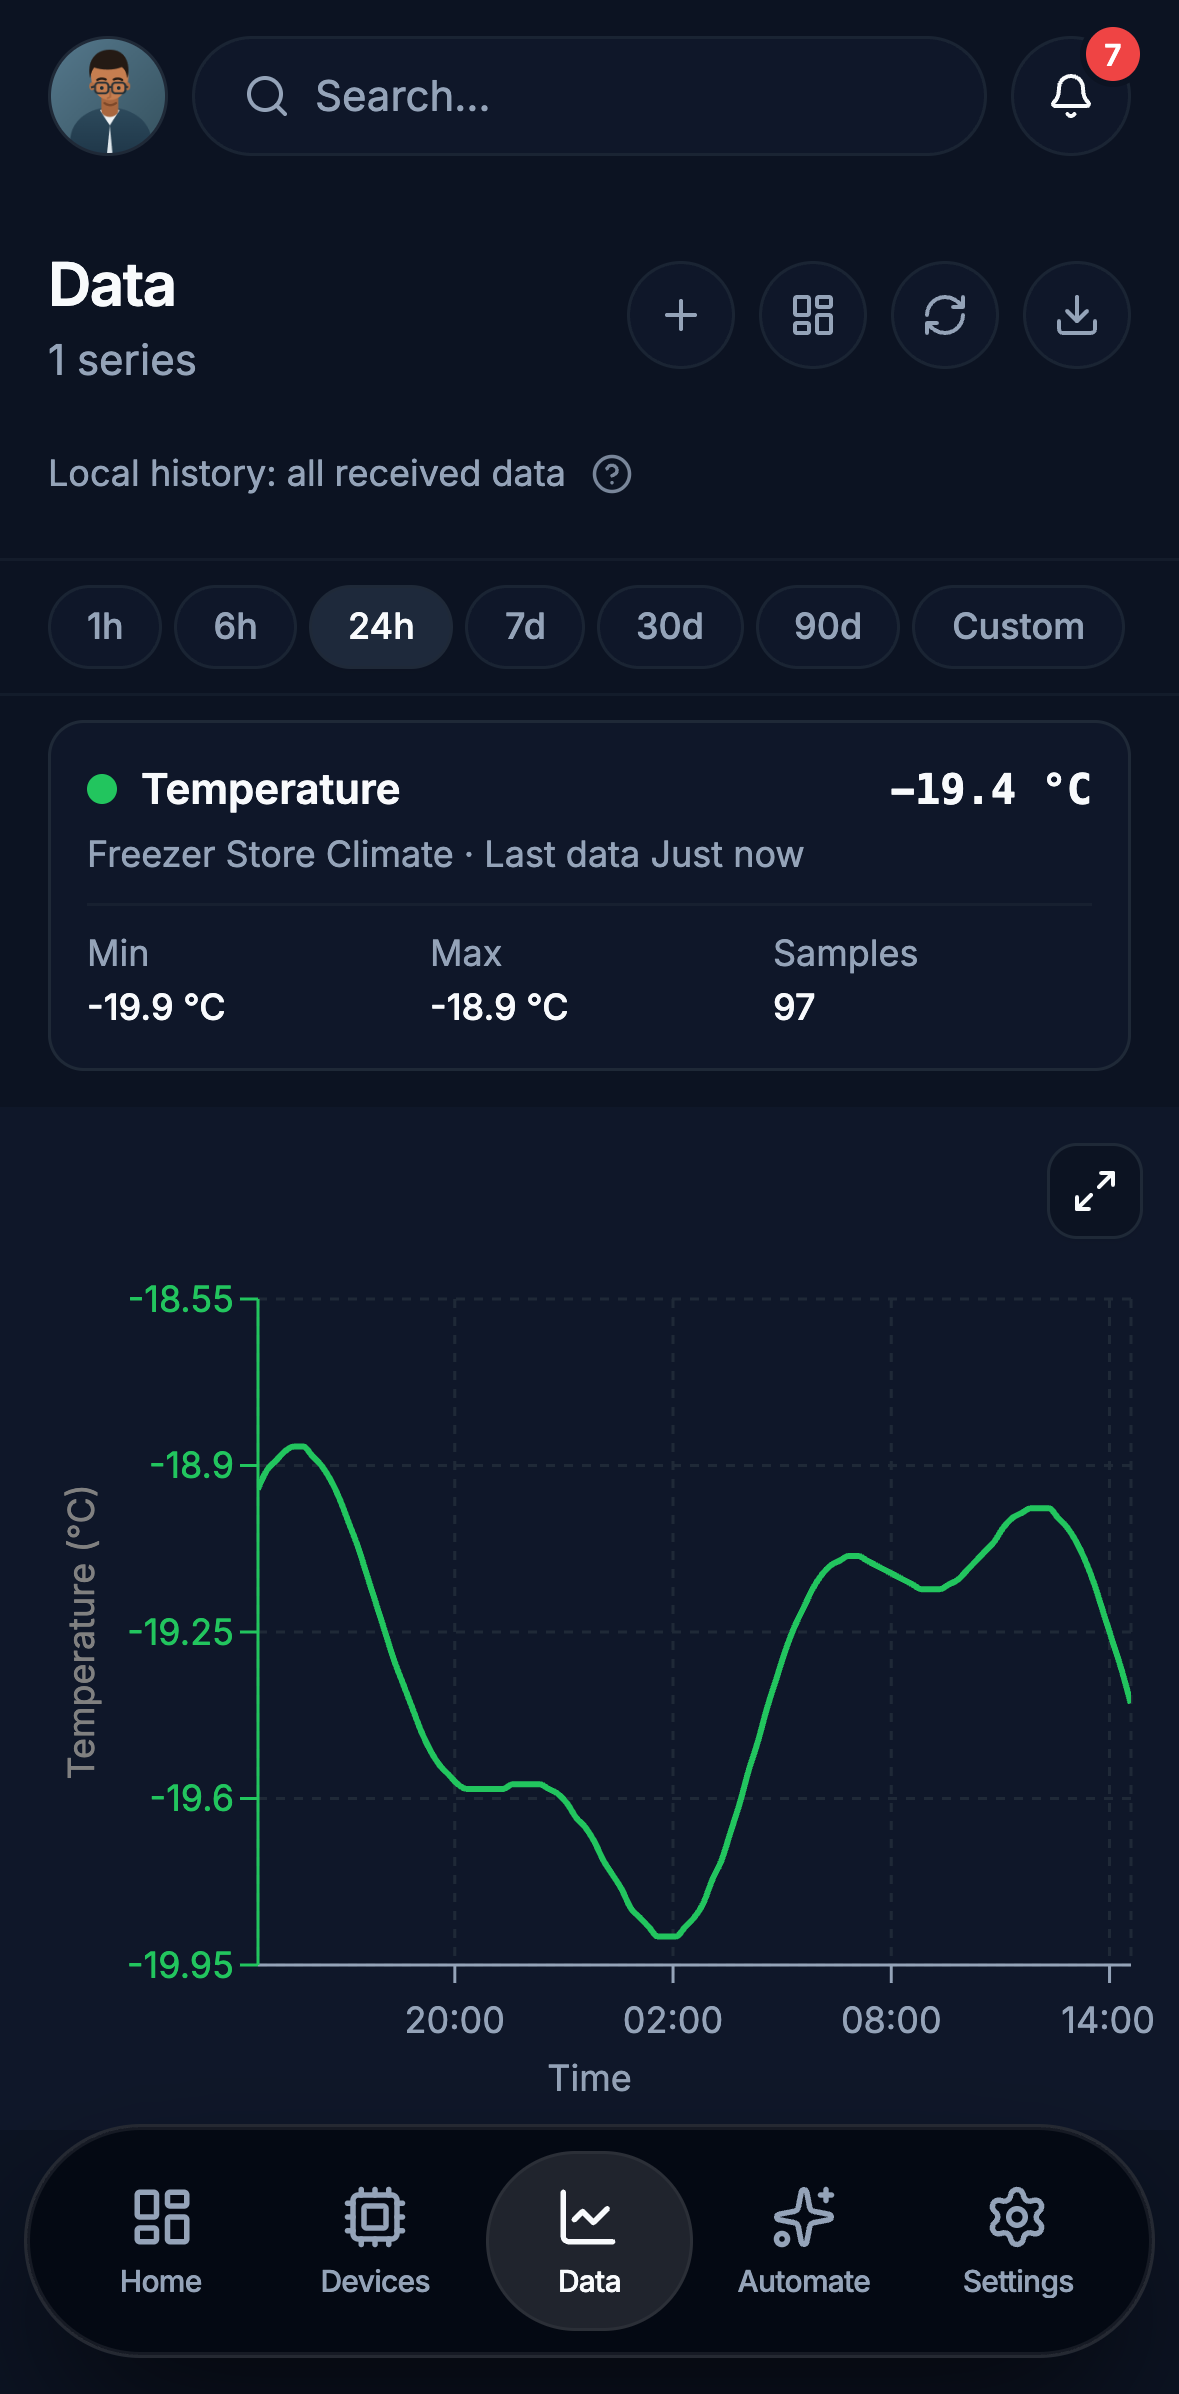
Edge on a phone: 24 hours of a freezer store temperature, reading -19.4 degrees Celsius, with its minimum, maximum and 97 samples above the chart, and the time ranges from one hour to custom.
Data Any sensor over an hour, a day or a month, with its minimum, maximum and sample count.
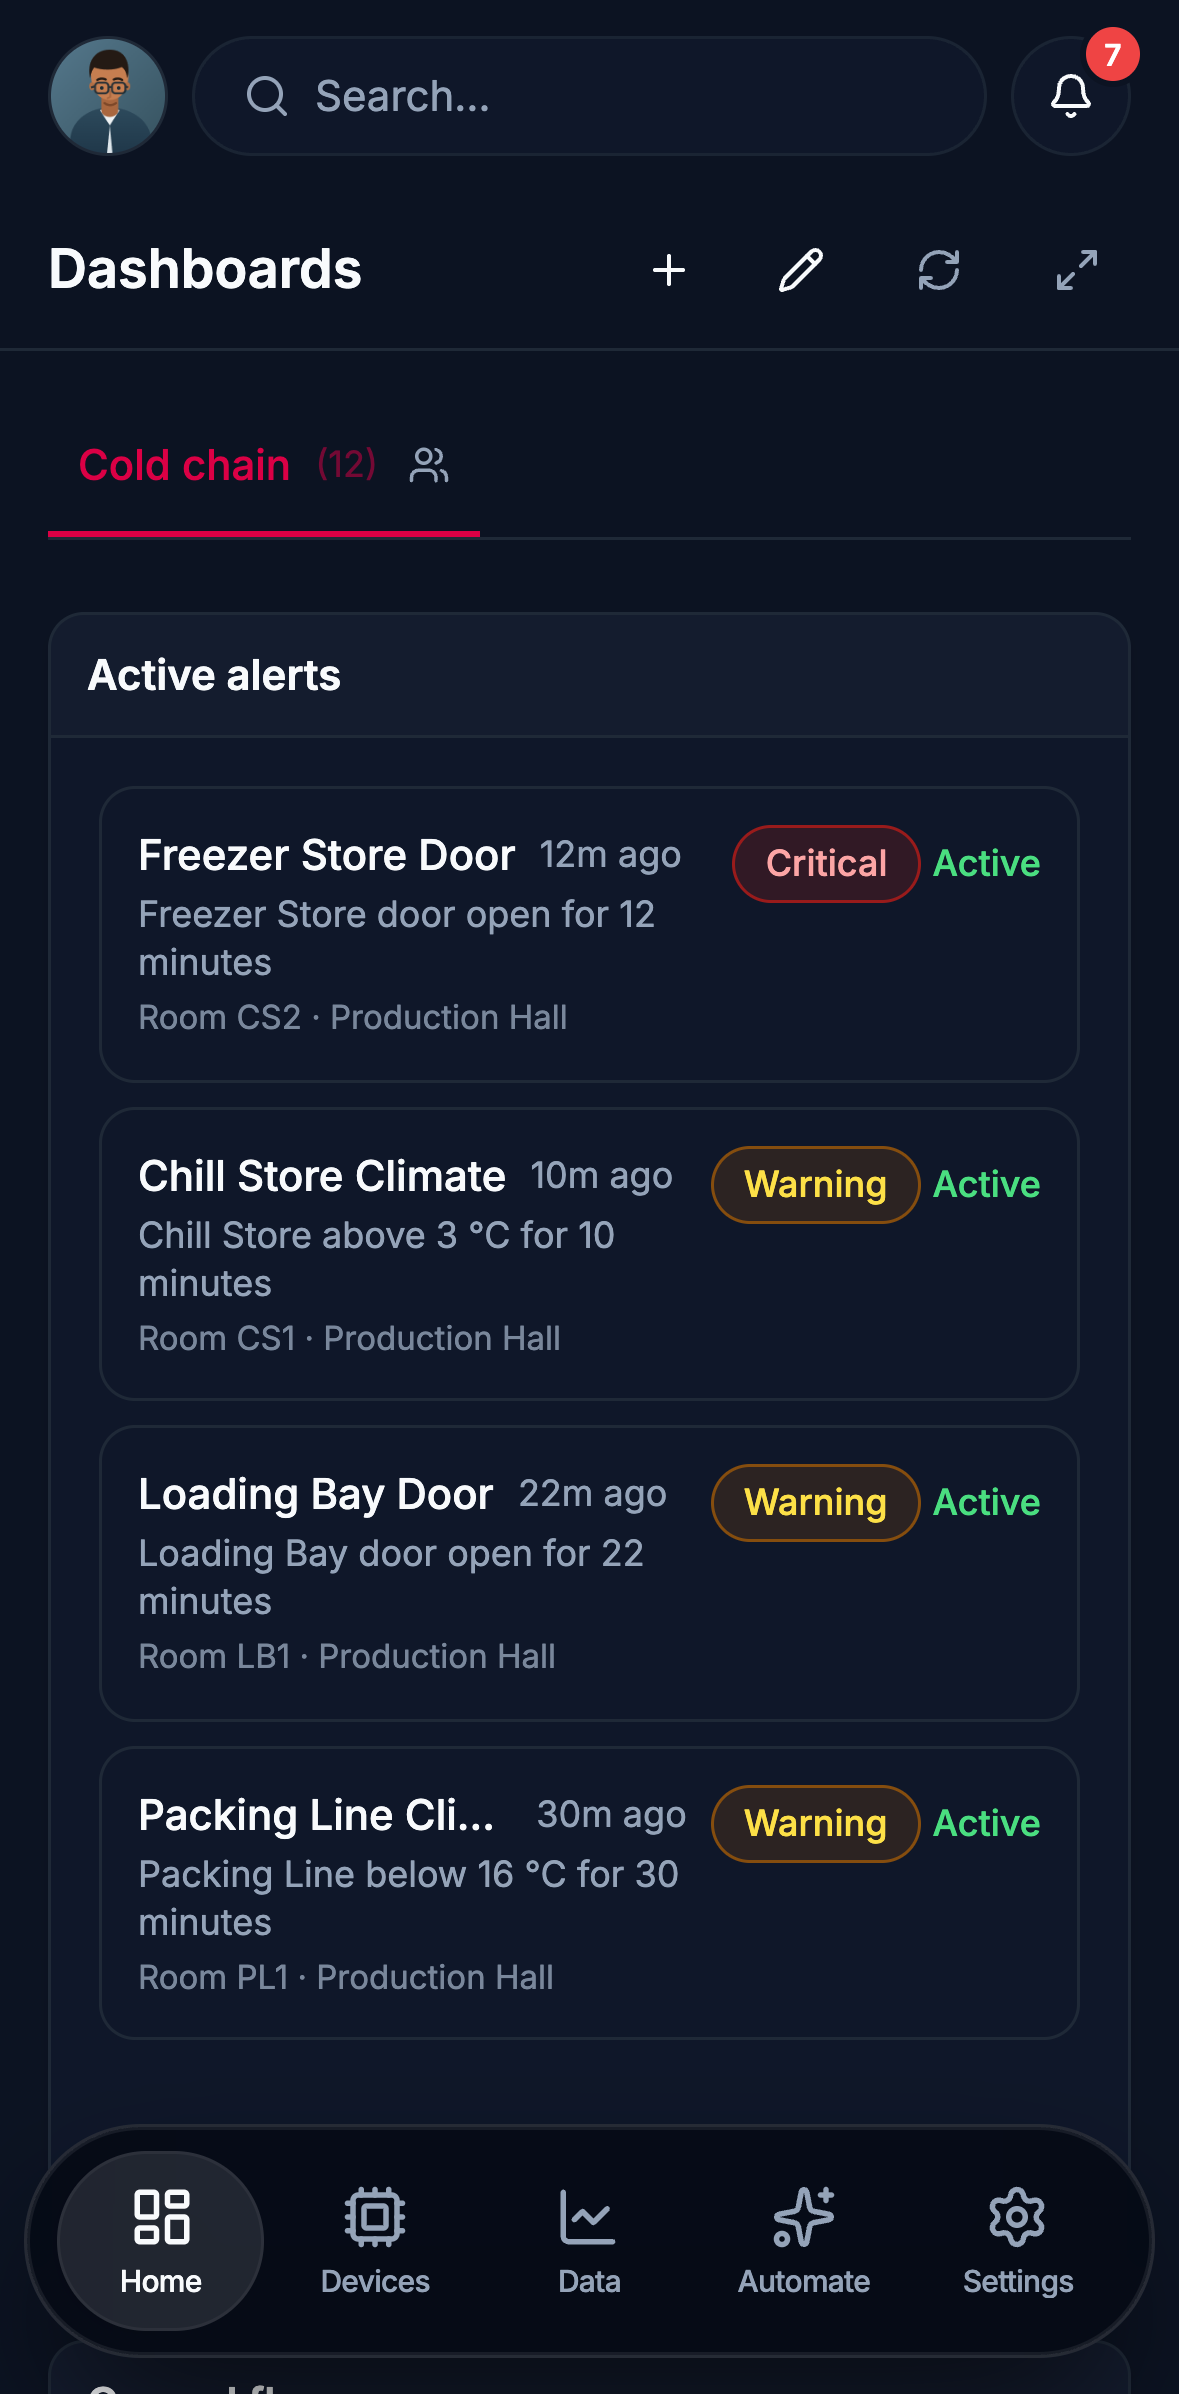
Edge on a phone: the Cold chain dashboard, its active alerts first, each naming the device that raised it, what the rule saw, its room and building, how long ago and its severity.
Dashboards A dashboard stacked for a phone, in the order it matters on one.
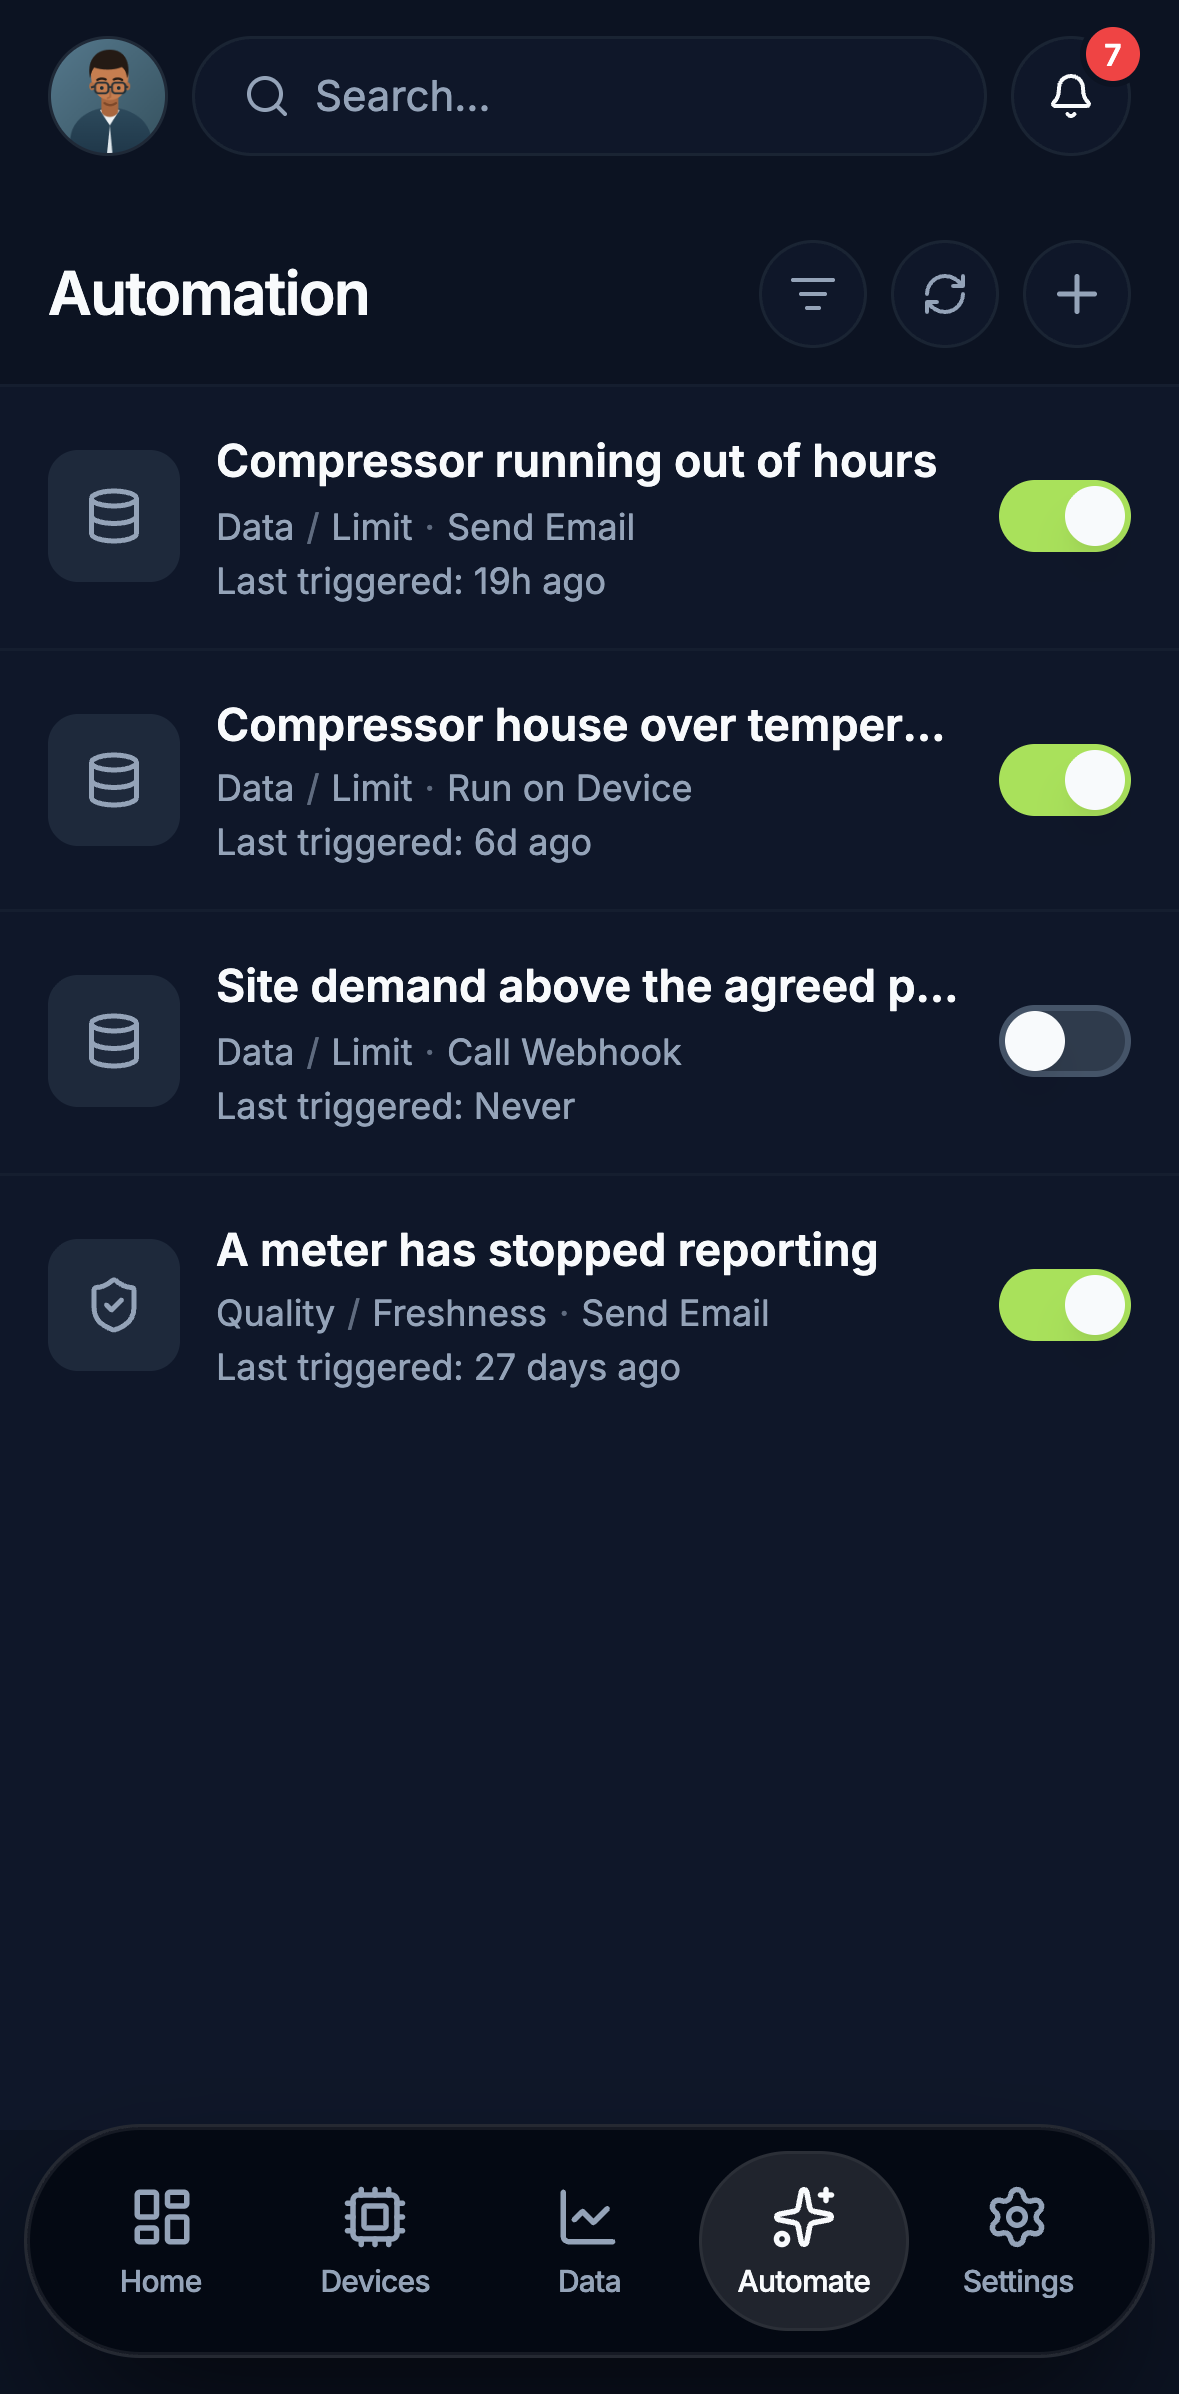
Edge on a phone: four automation rules, each with its trigger and action, when it last triggered, and a switch to enable or disable it.
Automation The rules running on the Gateway, with their triggers, actions and last run. Switch one off from here.
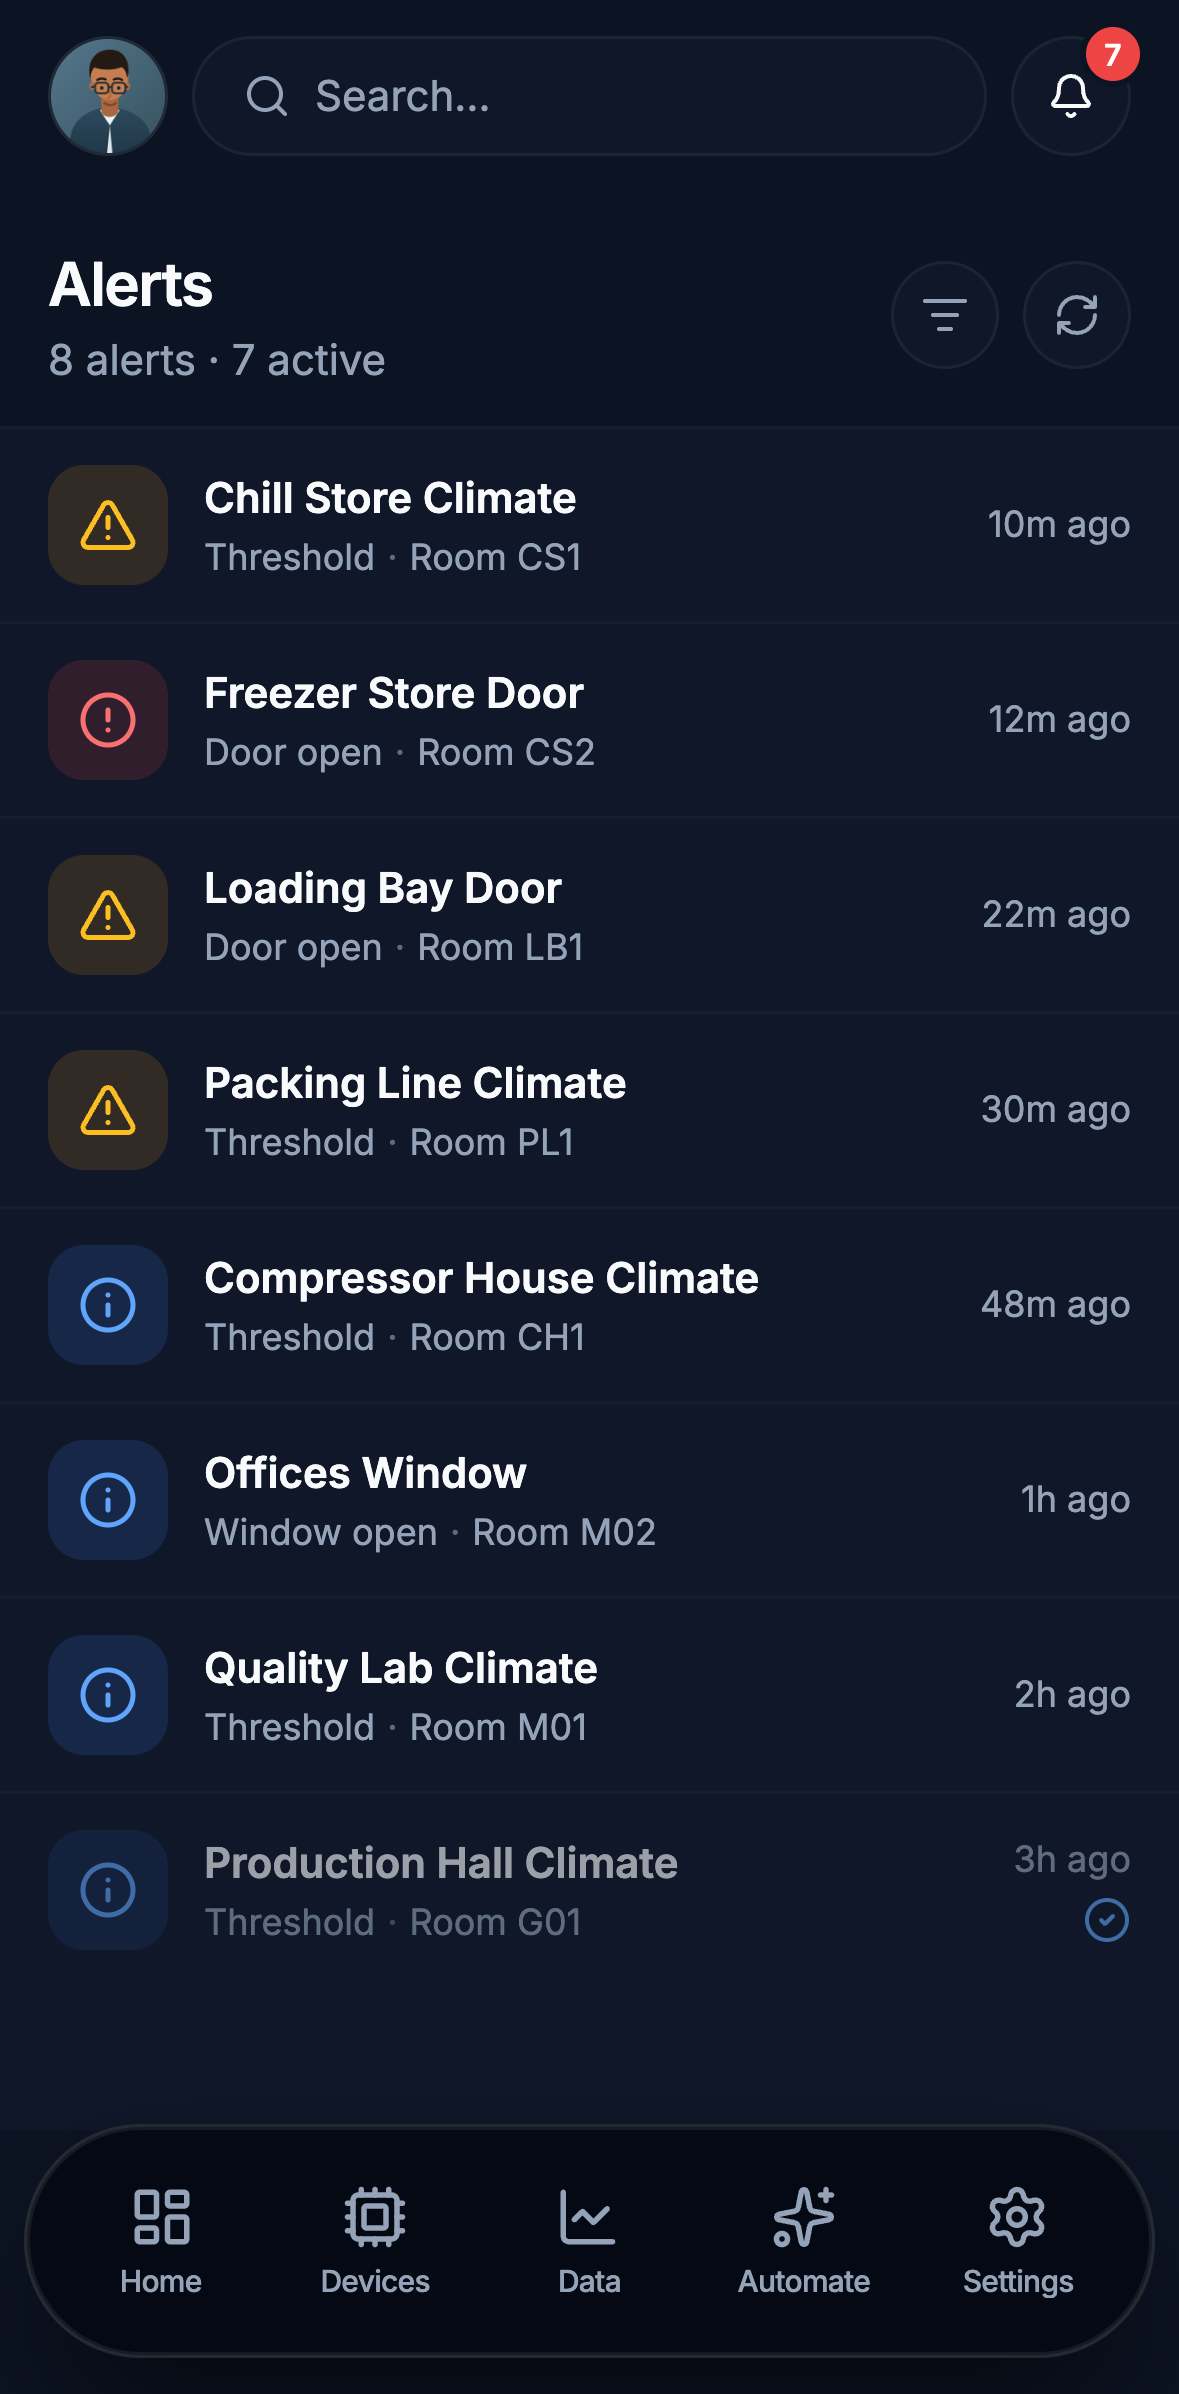
Edge on a phone: eight alerts over a morning, seven of them active, each with a severity icon, the device that raised it, the rule that fired and the room it belongs to, with a resolved one at the foot.
Alerts What needs attention: the device, what it did, its room and how long it has been open.
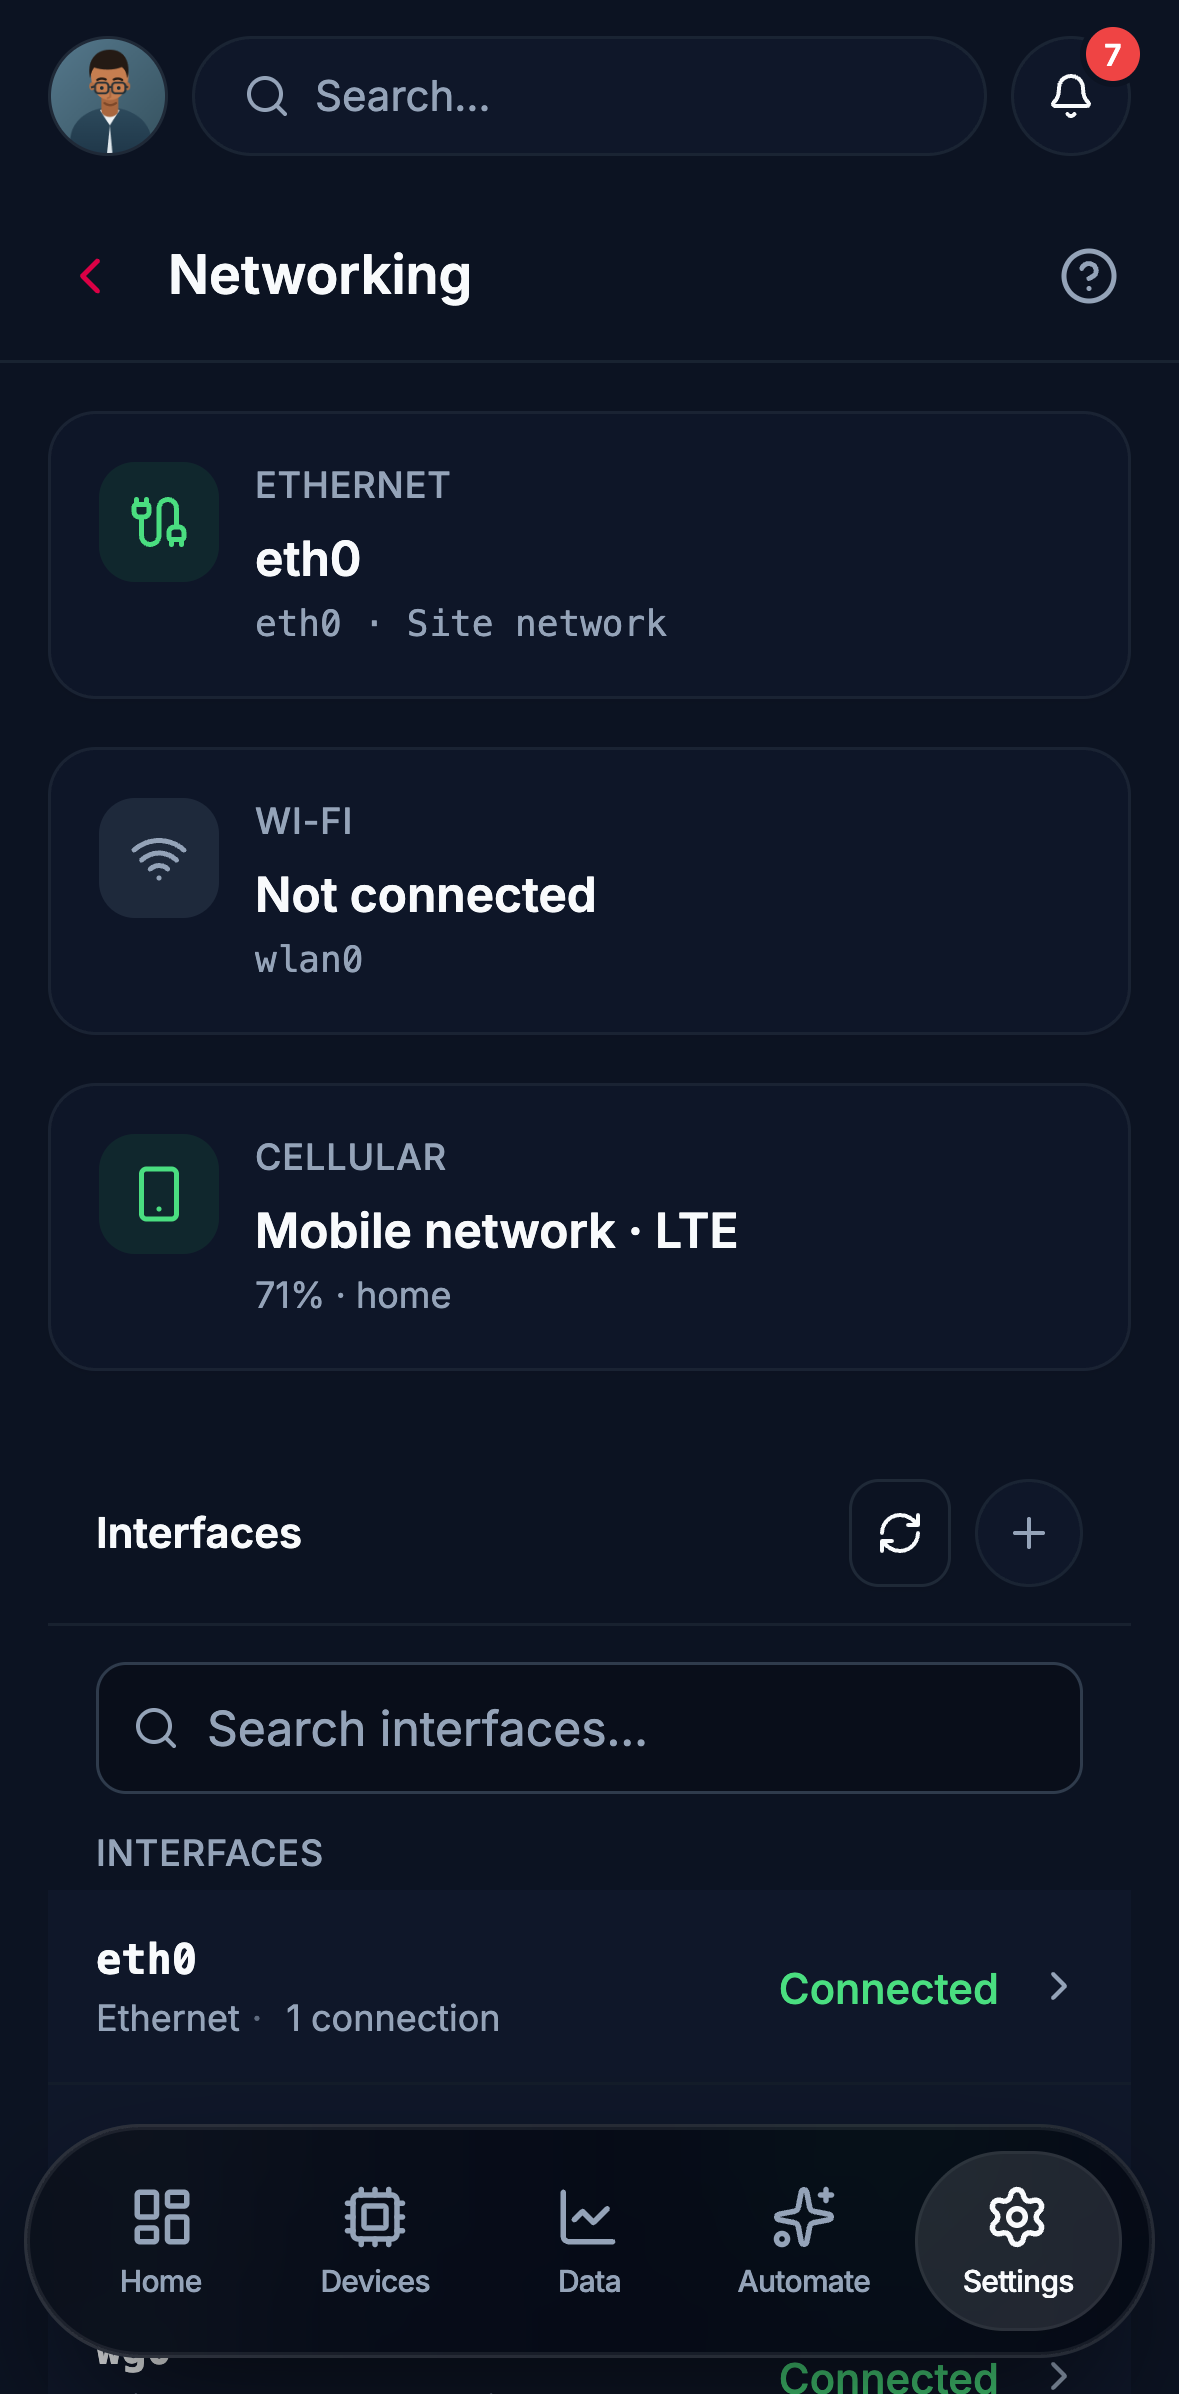
Edge on a phone: the networking screen, with cards for Ethernet, Wi-Fi and cellular, and the interface list below them.
Networking Ethernet, Wi-Fi and cellular on the Gateway you are standing beside.
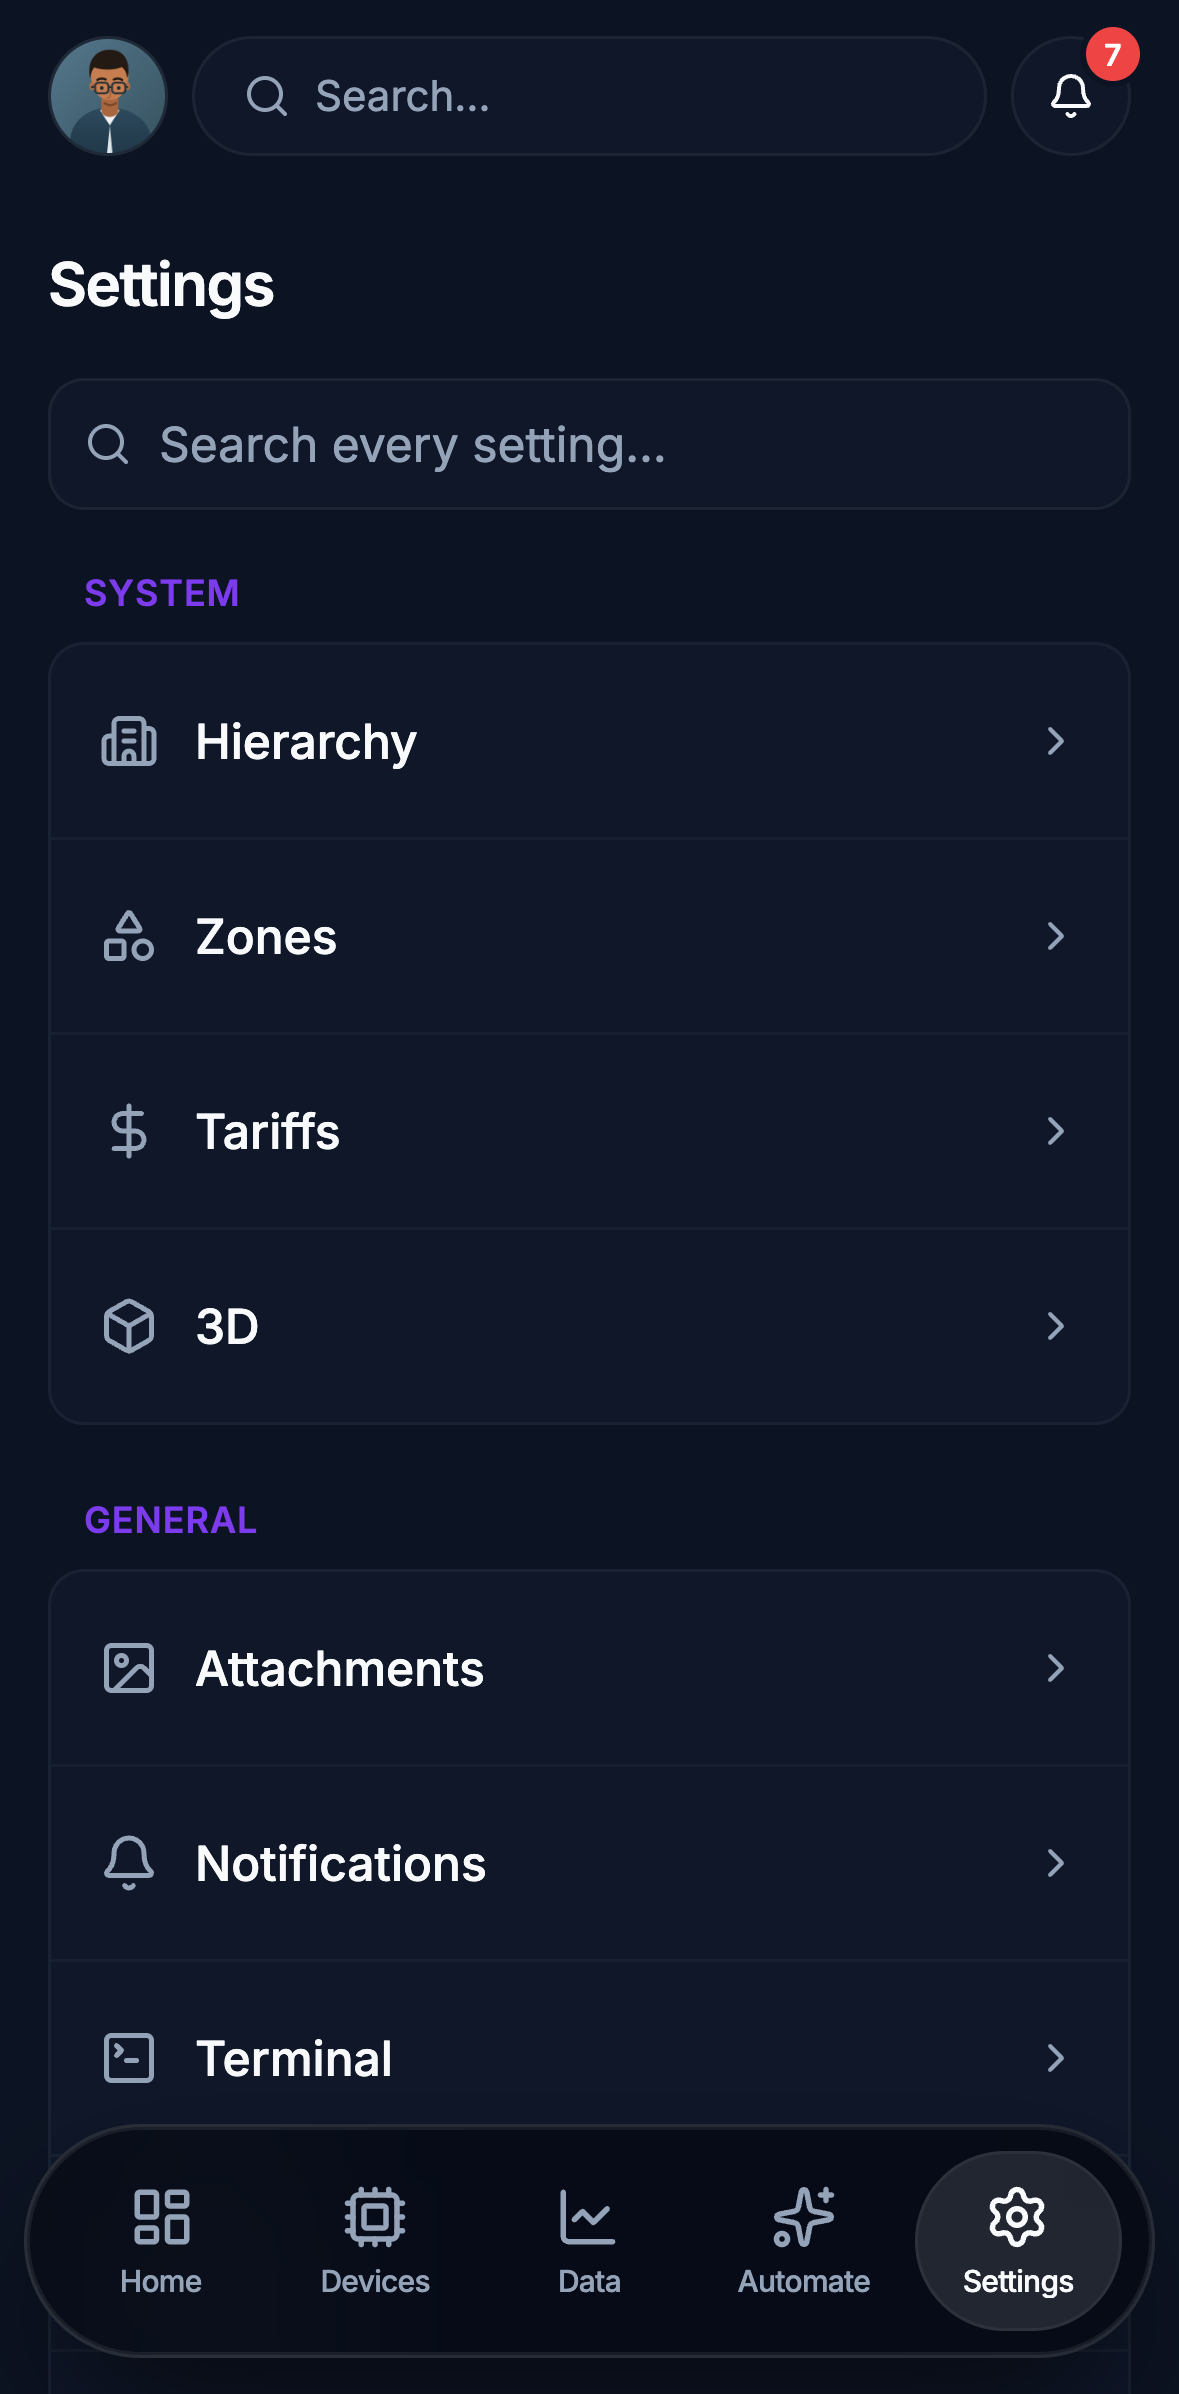
Edge on a phone: the settings screen, with a search field over the system and general sections, including hierarchy, zones, tariffs and notifications.
Settings The same settings as the browser, searchable rather than nested.
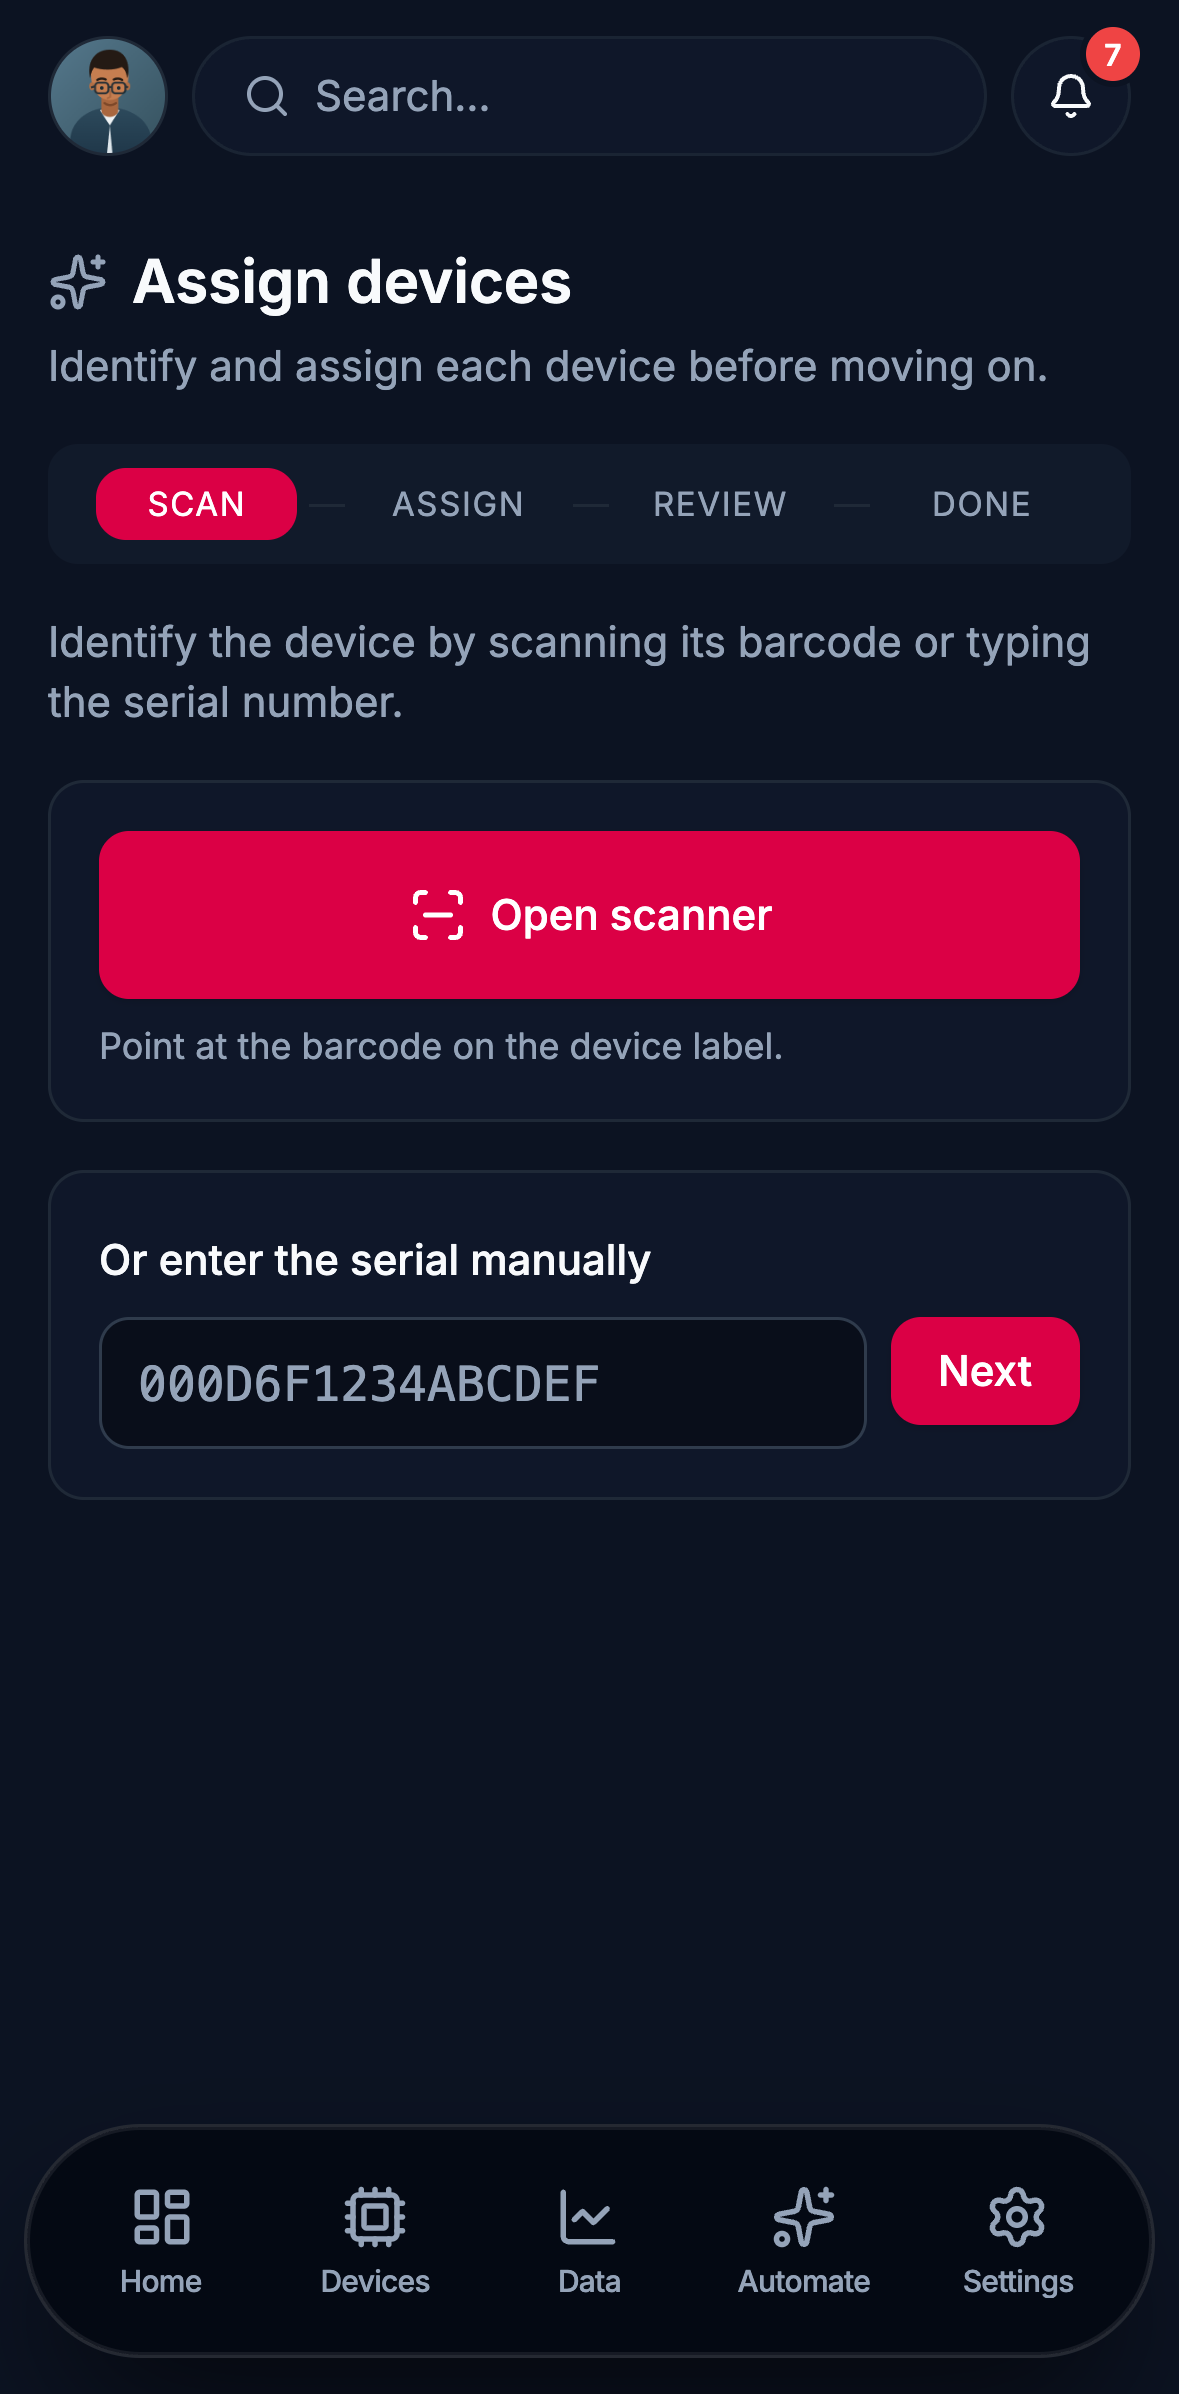
Edge on a phone: the assign devices screen, at the scan step, offering the barcode scanner or a field for the serial number.
Assign devices Commissioning: scan a barcode or type a serial, then give the device its room.
  • Every Gateway in one list

    Keep the Gateways you work on together, in folders you name and colour, and switch between them with a tap.

  • Find one on the network

    Scan the local network for Gateways when you arrive at a site, or add one by scanning its QR code.

  • Commission in the field

    Scan a device's barcode or type its serial, put it in its room, asset or utility, and add a note and a photograph.

What you can do with Edge

Dashboards

Build a dashboard around the work you do. Combine live values, trend charts, gauges, equipment status and controls, then arrange and resize the widgets for your team or a shared display.

Get the Edge apps for desktop and phone
Edge dashboard comparing mains and compressor power over 30 days, with a sustained compressor maintenance override, current readings, equipment status and energy totals.

A plant dashboard. The compressor load stays high because a maintenance override is on.

Everything a dashboard is built from

Place live values, charts, gauges, tables, alerts, controls and room overviews on a grid, and resize each one to the space it needs.

Freezer Store temperature, an Edge Single Value widget. One reading at full size over a sparkline of the last 24 hours.

Single Value

The one number a shift watches, large enough to read across a room, with the last day behind it.

Gateway, an Edge Info widget. A labelled table of fixed facts: firmware, platform, uptime, stored readings.

Info

The fixed facts about a unit, so nobody opens a terminal to check a firmware version.

Devices by room, an Edge Donut widget. Category totals as a donut, with the total in the middle and a counted legend.

Donut

How a total divides, for the times the split matters more than the trend.

Zone heating setpoints, an Edge Control widget. A setpoint slider over the three zones it writes to, each with the temperature it holds now.

Control

Send a command back to equipment that accepts one, beside the reading that prompted it.

Chill Store temperature, an Edge Gauge widget. An arc gauge with named colour zones, a live value and the room it came from.

Gauge

Whether a reading sits where it should, without anyone having to read the scale.

Cold chain, 7 days, an Edge Visualisation widget. Two rooms over seven days on one axis, so the difference between them is the picture.

Visualisation

Two quantities on one timeline, to see which of them moves first.

Refrigeration plant, an Edge Table widget. Rows the dashboard author writes, for a register that does not belong on a chart.

Table

An inventory that a chart would only flatten: rows, columns and a header.

Active alerts, an Edge Alerts widget. Alerts as they arrive, each with its severity, the room it came from and how long it has been open.

Alerts

What needs attention, filtered to the severity and the area that is yours.

Ground floor, an Edge Callout widget. Live readings labelled on a floor plan, each one leading to the room it was measured in.

Callout

Your own floor plan or photograph, with the points that matter labelled on it.

Rooms, an Edge Room Overview widget. Every room of the building as a tile, with occupancy and a status dot.

Room Overview

A whole building at once, so a cold room is obvious from the doorway.

Electrical single line, an Edge Image widget. A fixed picture beside the live ones: here, the drawing that says which board each meter is on.

Image

A diagram, a logo or a reference picture, where a screen needs context rather than data.

Devices

Edge presents wired and wireless devices through one data model. Monitor their sensors and create automation rules across protocols and physical connections, from a wireless temperature sensor to a Modbus meter or building controller.

Devices that work with Edge
An expanded EpiSensor meter in the Edge device list, with its product image, online status and individual phase energy and current readings underneath.

Expand a device to see and use each of its sensors.

Automation

Respond to a threshold, a schedule or a change in equipment state. Notify the right people, call a webhook or control a device. The rule runs locally, on site.

Local control for demand response
The Edge automation list: four rules with their on and off switches, trigger type, name, action, author, age and when each last fired. Their actions are Send Email, Run on Device and Call Webhook.

Four rules: two check a reading against a limit, one alerts when a meter stops reporting, and one is switched off. Between them they send an email, run a device command and call a webhook.

Data

Compare sensors and time periods in one workspace. Choose a date range, show or hide series, and adjust each chart’s axes and presentation. Send a useful view to a dashboard or export the selected data to CSV.

Energy monitoring with Edge
Edge Data workspace with a 24-hour battery and solar chart and the active series table.

Battery and solar over 24 hours. Positive battery power is discharge, negative is charging.

Buildings and assets

Organise a site into buildings, floors, rooms and assets, then read live conditions in their physical context. A room shows what the devices standing in it are reporting, so a floor tells you its own state without anyone opening a chart.

Application guides
The six ground-floor rooms of a plant in Edge, each card reading its temperature, humidity and, where the room has them, its lighting and door state, with the room's name, device count and whether it is occupied.

Rooms in the app. Each card shows what the devices in that room report, and the number beside the name is how many devices are in it.

Calculated sensors

Combine sensor inputs into calculated values. Use them in dashboards and automation, just like physical readings, then share the data through authenticated APIs and open export formats.

Engineering tools
Edge calculated sensor editor averaging two climate sensors, with the live preview resolving both readings and their mean.

A calculated sensor averaging two climate sensors.

Protocols: what Edge supports

One Gateway speaks to the equipment already on your site. Each protocol is an extension you enable in Settings and configure per connection.

Read the extension guides
  • Zigbee

    EpiSensor electricity monitors, pulse counters, sensors and relays join the Gateway's 2.4 GHz mesh, as do supported third-party Zigbee devices. Each arrives with its measurements and commands named.

    Zigbee devices
  • LoRaWAN

    Third-party LoRaWAN sensors reach the Gateway over long range on battery power. Register one on your LoRaWAN network server with its DevEUI and keys. Edge reads the decoded uplinks from that server and adds each field as a sensor.

    LoRaWAN devices
  • Modbus TCP and RTU

    Read coils and registers from meters, inverters, PLCs and controllers over Ethernet or RS-485, and write to them where the device allows. Map each register to a named sensor with its data type.

    Modbus meters and register maps
  • BACnet/IP

    Discover controllers on the network and read the present value of analogue, binary and multi-state objects. Write to output and value objects when a control sequence needs it.

  • OPC UA

    Connect to an opc.tcp endpoint with the security mode and identity it requires: anonymous, username or certificate. Read variables by NodeId on a schedule, and write to the ones you mark writable.

  • IO Board

    IO at the Gateway itself, with no separate IO module. The ZGW-20's optional boards add two 4-20 mA inputs, two pulse counters and two relay outputs. Each channel appears in Edge as a sensor, and the relays can be switched from Edge.

  • Cameras

    A USB camera and a vision model on the Gateway turn what the camera sees into readings: a dial read as a number, objects counted, a state classified. Captures run on a schedule you set.

  • Modbus server

    The other direction: Edge exposes readings as registers and coils, and a SCADA or building management system polls them from the Gateway over Modbus TCP.

Everything Edge sends outward, over MQTTS or HTTPS, as files or through its API, is in Connect to your platform.

Adding a device

Every connection starts the same way. Choose the family, and Edge asks for what that protocol needs: a network and a unit ID, an endpoint and its security, a serial port, or the sensors a calculation reads.

Whatever a device speaks, it lands in the same inventory, with the same status, sensors, history, automation and licence as every other device.

The top of the Add Device dialog: Zigbee, Modbus, Calculated and Camera, each with a line describing what it connects.
The Edge device inventory on a Gateway set up to show every kind of connection: a BACnet controller, a calculated sensor, Zigbee meters and climate sensors, a Modbus meter, an OPC UA PLC and a camera, each with its model, type, online status, power source and tags.
Six kinds of connection in one device list.

What each protocol asks for

The wizard is the same shape every time: the connection, what to read, what to call it in Edge, and how often to report it.

  1. Modbus

    Give each register its address, name it, and choose its data format: a 32-bit float, an unsigned integer, read-only or read/write. The Mapping step that follows sets the function code, the precision and the sensor each register becomes.

    The Registers step of the Modbus device editor: ten registers of a three-phase meter in a four-column table, each with its register address, the name it takes in Edge, its data format and a row of actions.
    Ten of the 32 registers a virtual Modbus device can hold.
  2. BACnet/IP

    Scan the network, pick the controllers you want, then map their objects to sensors with their units and precision. Analogue, binary and multi-state inputs, outputs and values.

    The Mapping step of the BACnet device editor: seven objects of an air handling unit, analogue inputs, analogue outputs, a binary input and an analogue value, each mapped to an Edge sensor ID with a name, unit and precision.
    Mapping: each object becomes a named Edge sensor.
  3. OPC UA

    Address each variable by its NodeId, set its data type and unit, and choose how often Edge reads it. Endpoint security and identity are set on the connection.

    The Mapping step of the OPC UA device editor: six node IDs from a packing line PLC, each with its Edge sensor ID, name and data type of Float, UInt32, Double or Boolean.
    Six of the nodes one OPC UA device can carry.
  4. Cameras

    Pick the vision model, and its outputs become the device's sensors. Set how often a frame is captured and how confident the model has to be before it reports.

    The Configure step of the Add Camera Device wizard: a detection model with three sensor outputs, a binary detection, a count and a confidence percentage, with Snap to Clock reporting every 15 minutes and a confidence threshold of 0.75.
    A frame every 15 minutes, read by a model on the Gateway. The frame is discarded; the reading is kept.

Running the Gateway

Edge manages the computer it runs on as well as the data on it: the packages installed beside it, the networks it sits on, and the firmware it hands out to devices. All three are in Settings, on the Gateway itself.

Gateway

Ubuntu Core, and snaps beside Edge

The Gateway runs Ubuntu Core, and Edge is a snap on it beside the Zigbee bridge, the MQTT broker, time sync and the network manager. Search the Snap Store from Settings to install a broker, an agent or your own packaged software on the same box.

The Edge Snaps page listing nine installed snaps, each with its own store icon, publisher, active status, version, channel and description: Edge, the Zigbee bridge, MQTT broker, time daemon and certificate signer among them.
Every snap on a Gateway, EpiSensor's and the operating system's.

Networking, in the app

Ethernet, Wi-Fi and cellular, with the interfaces, their traffic and their saved connection profiles on one page. Each profile carries a priority, which is how a Gateway is told to prefer the site network and fall back to Wi-Fi or a metered SIM.

The Edge networking page: cards for Ethernet, Wi-Fi and cellular, then five interfaces with their type, status, traffic, connection profile, role and priority, and a chart of 24 hours of transfer on the interfaces.
Five interfaces: a site uplink, a plant network, a WireGuard link for remote support, a Wi-Fi fallback and a metered SIM.

Device firmware, over the air

Upload firmware images to the Gateway and it keeps them in a catalogue, each checked as it arrives and listed with its manufacturer, model and version. From a Zigbee device that reports over-the-air support, check for an update, schedule one, or send it now. Edge itself updates through its snap channel or the desktop app, not from here.

The Edge firmware page: six stored images with their filename, type, manufacturer, model, version, the date they were added, their size and whether they are valid.
The images stored on one Gateway, ready to send.

Connect to your platform

Keep the analytics, reporting and trading platforms you already run. An integration flow on the Gateway decides what leaves the site, what shape it arrives in and where it goes.

Energy software platforms
An integration flow on the Edge canvas, in four labelled groups: read equipment, a Modbus meter read every minute and Zigbee sensor reports, each scaled by a function node; transform, one node building the platform message; deliver to platform, a switch sending it to an MQTTS publish node, an HTTPS POST node or a held-for-review node; and handle errors, a catch node logging any delivery error.
One flow, end to end: a Modbus climate sensor read every minute and every Zigbee report, mapped into one platform message, delivered over MQTTS and HTTPS, with delivery errors caught rather than lost.

The flow editor

Edge's backend is a flow editor built on Node-RED, served by the Gateway. Drag nodes from the palette, write JavaScript in a function node, reshape a message with a JSONata expression, and watch the real messages your flow produces in the debug panel as you build it.

Modbus, OPC UA, serial, SQLite and MQTT nodes are on the Gateway already, so a flow can reach most equipment without installing anything. Flows are packaged and installed from Settings, whether EpiSensor built them, a partner did, or you did.

  • The editor's node palette, filtered and grouped: subflows, then the common group with inject, debug, complete, catch, status, link in, link call and link out nodes.
    Start from the palette Every node the Gateway has installed, grouped and searchable. Drag one onto the canvas and wire it into the flow.
  • The debug panel holding a message the flow has just built: the site, the source, the device name, a timestamp, and an array of two readings with their names, values and units.
    Watch the real messages The debug panel, showing what the flow actually produced: the site, the source, the device and its readings, as the platform will receive them.
  • A function node open in the editor's code editor, with the JavaScript that turns Modbus register values into named readings with their units.
    Write the logic A function node, where the message is reshaped in JavaScript: here, Modbus register values become named readings with their units.
  • The JSONata expression editor: the expression that builds the platform message above, an example message below it and the result of running one against the other beside that.
    Shape the payload A JSONata expression, tested against a real message as you write it, so the platform gets the field names it expects.
  • The MQTT broker configuration opened from the publish node: the broker host, port 8883, and TLS switched on with a TLS configuration selected.
    Publish over MQTTS The broker, its port and its TLS configuration, the way Core and the platforms EpiSensor connects to are reached.
  • The HTTP request node: a POST to an HTTPS endpoint, TLS enabled with a TLS configuration, a JSON content type, and non-2xx responses passed to the catch node.
    Or POST over HTTPS Your endpoint, your headers, certificate checking on, and anything that is not a success handed to the error branch.

How Edge sends data out

MQTTS
Publish readings to a broker over TLS, with the certificate or credentials that identify this Gateway. It is how Core is connected, and how most platforms take live readings.
HTTPS
Send readings to an endpoint as Edge JSON or in your own shape, with your headers, batching and delivery counters. Certificate checking is on by default.
The API
Everything the Edge apps do, published as an OpenAPI contract and reached with a token: devices, sensors, history, configuration and the audit trail.
Files
Where a platform takes files rather than messages, a flow writes them: CSV to object storage for a reporting platform, or the Gateway's own scheduled export to FTPS or SFTP.

Where the data can go

Each connection is a flow built for the platform it serves. The Gateway can reach anything that takes MQTTS, HTTPS, files or an API, and a building management system or SCADA can poll Edge as a Modbus server.

Examples

  • IoT servicesAWS IoT, Azure IoT
  • Reporting and analyticsGrafana, Power BI
  • Time-series storesYour own database
  • Energy and flexibility platformsOver MQTTS or HTTPS

These are examples, not a list of ready-made connectors. Each needs a platform-specific flow over MQTTS, HTTPS, files or the API.

Managing multiple sites

Core brings remote Gateways and their devices into one Edge workspace. Check the health of every site, and work with devices, automations and snaps across the fleet.

Run Core on a Gateway or a central server. Each site keeps its own Edge.

Core for fleets of Gateways
The Core Gateways register: six Gateways across a demonstration food group, each with its serial, online status and sync interval, Edge and Core client versions, processor, memory and disk use, uptime, device count, tag and data transferred. One reports a disk-usage warning, one has been out of contact for 27 hours, and one is still being commissioned.
Every site in one register, with the health of each.

Applications

Edge is the site layer behind both of EpiSensor's main applications.

Edge pricing

Edge comes with every EpiSensor Gateway. You only pay for devices from other manufacturers, or to run Edge on hardware of your own.

On an EpiSensor Gateway

Every EpiSensor Gateway ships with Edge installed and licensed for commercial use.

Configure a Gateway
IncludedEdge comes pre-installed

EpiSensor devices

Connect as many EpiSensor devices as your Gateway supports, usually up to 250, with no device licence.

Browse hardware
IncludedNo device licence needed

Third-party devices

For Zigbee, LoRaWAN, Modbus, BACnet and OPC UA equipment from other manufacturers. One licence for each device.

Choose device licences
€6per device / month

Billed annually

or
€199per device, once-off

No recurring fee

Standalone licence

Install Edge on your own server, a virtual machine or a Raspberry Pi.

€499Once-Off

Try it first. Edge includes one third-party device licence for evaluation and non-commercial use.

Support is €16 per Gateway per month, billed annually. Support plans

Prices exclude VAT. Subscriptions are billed once a year. Volume pricing applies up to 100 devices; about larger quantities.

Talk to an engineer about your site

Tell us about your equipment, your platform and what you want Edge to do.

Read the documentation