Solar PV and battery storage in Edge
Follow solar PV, battery storage and site consumption in Edge, with Modbus readings, tariff calculations and an alert rule using demonstration data.
Read the transcript
Last year, Ardglass Foods put a hundred and fifty kilowatts of solar panels on the Production Hall roof, and a two hundred kilowatt-hour battery in the yard. The aim was simple: a smaller electricity bill. Now the team has two questions. Is it paying off? And is it doing its job, filling the battery from the midday sun, and carrying the plant through the evening peak?
The solar panels and the battery each have an inverter. The Gateway reads both over Modbus TCP, on the site network, right beside the Zems that already meter the plant. In Edge, they're two Modbus devices, and every register is a sensor. Power and energy from the solar inverter. State of charge, charge power and cycle count from the battery.
Next, they're modelled as what they are. Edge has built-in equipment types for Solar PV and Battery Storage. Both go in the Production Hall, and each inverter is assigned to its asset. Each asset opens on its own Overview. The array's power comes from the inverter. Map it once, and the day fills in: today's energy, the peak, and the whole day's curve, against yesterday. The battery's state of charge and power come from its own controller, charted across the day, against its fifteen percent reserve. Edge also calculates its round-trip efficiency, from the energy in, the energy out, and the change in what's stored.
Everything else is entered once, on the asset itself: its usable capacity, its reserve, its warranty cycles, and the tariff it's valued at. That's how the cycle count is shown against the warranty. Edge also works out what the battery earned today. What it discharged is valued at the import rate, less whatever it cost to charge from the grid. Charging from the solar costs nothing here, because there's no export tariff. The grid meter tells the two apart.
Chart the two together, and you can see it working. The solar climbs past eighty kilowatts. The battery fills from the midday surplus. And from half past four, it gives that energy back to the plant, right through the evening peak.
So, is it paying off? A Calculated device prices every kilowatt-hour the roof makes, using the site's day and night tariff, and a second one adds it up for each day. Yesterday, the roof's output was worth up to a hundred and forty-two euro at the day rate. A cloudy day earns less. Now the team can watch it add up, week by week.
And to keep it behaving, an automation watches the battery. If its charge falls below twenty percent between half past four and nine in the evening, Edge raises an alert, and emails the team. Now generation, storage and consumption are all in one place. The solar and the battery sit right beside the plant's own meters, and it's all read and worked out on the Gateway, on site.
That's one site, cutting its own bill. If you're a trader or an aggregator, Edge is the best platform to optimise solar and storage across all your sites. The simplest way in needs no integration at all. Core, our fleet platform, brings every site together in one place. Through Core's API, your own platform can read every battery and solar inverter, and send them setpoints and schedules.
If you want to run your own strategy, algorithm or schedule on site, you can, as a custom flow. It runs inside Edge, on the Gateway, and it keeps running even if the site's internet connection drops. But you don't have to. Core's API is all it takes to get started.
That's solar PV and battery storage, in Edge.
Related videos
-
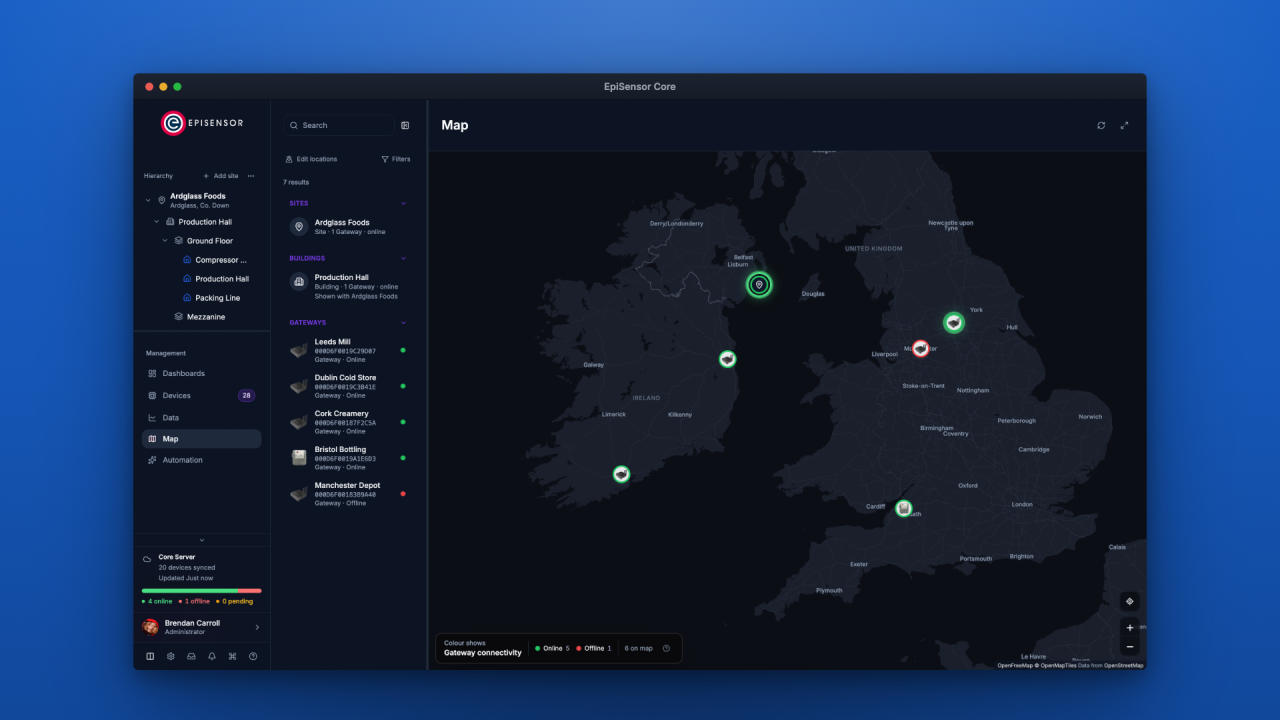
Multi-site energy monitoring with Core
See fleet health, remote devices, local rules and Gateway onboarding in EpiSensor Core. The sites, readings and incidents shown are demonstration data.
Watch video · 2:42 -
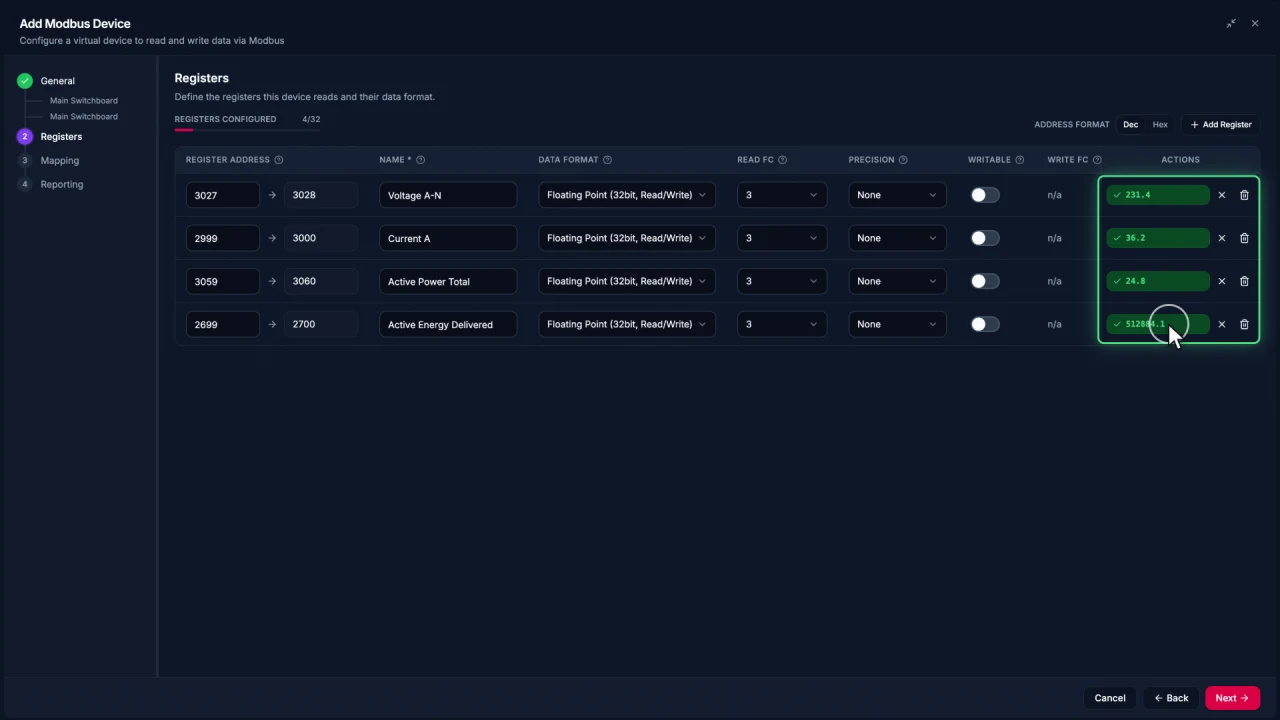
Connecting Modbus meters in Edge
Add a Modbus TCP meter in EpiSensor Edge, configure and test registers, then reuse the verified device template for another meter.
Watch video · 2:30 -
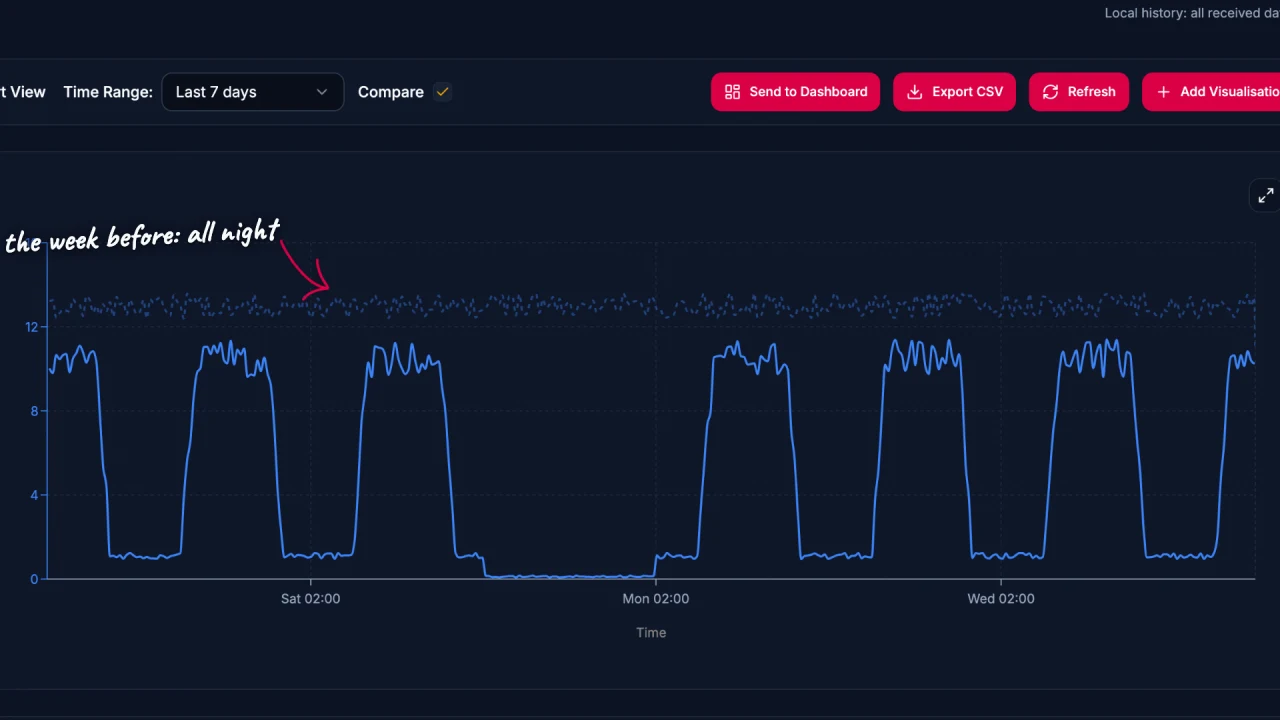
Energy data analysis in Edge
Explore energy data in EpiSensor Edge with charts, period comparisons, zoom and heatmaps. The example traces a compressor running outside expected hours.
Watch video · 2:17 -
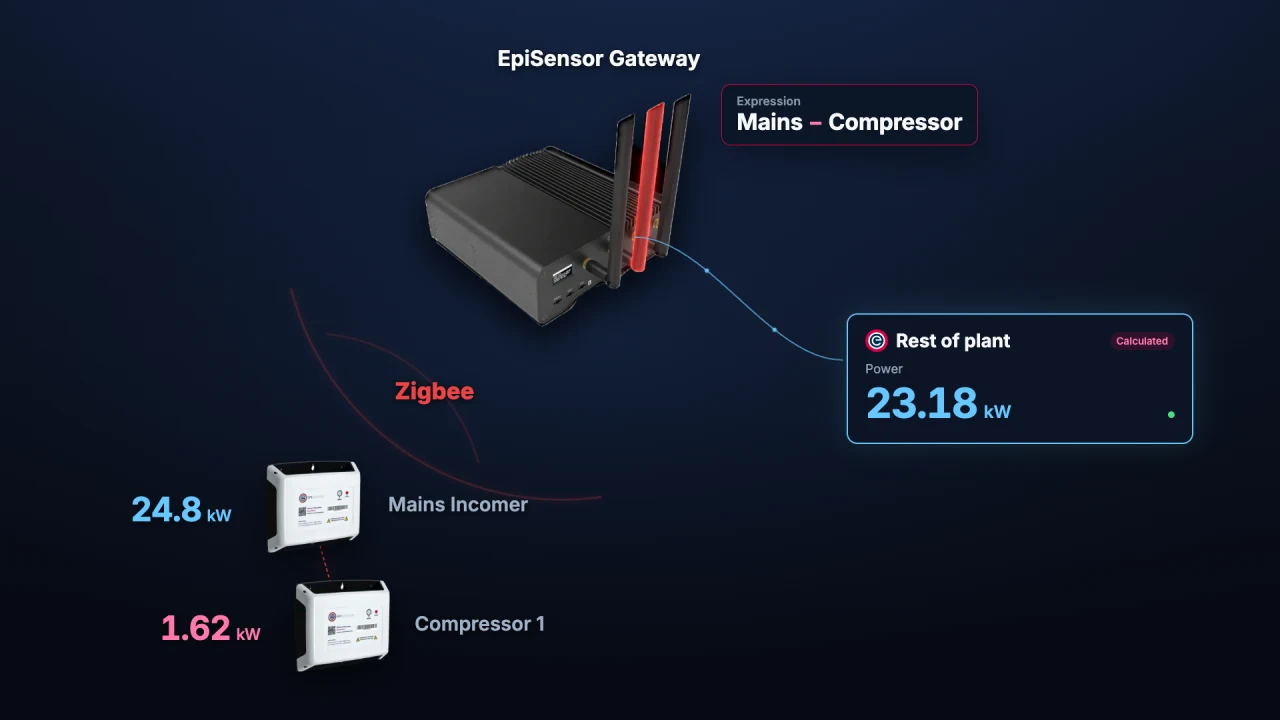
Calculated Devices in Edge
Create calculated measurements from sensors already in Edge. Run operations on the Gateway and chart, monitor or automate the resulting sensor.
Watch video · 1:56 -
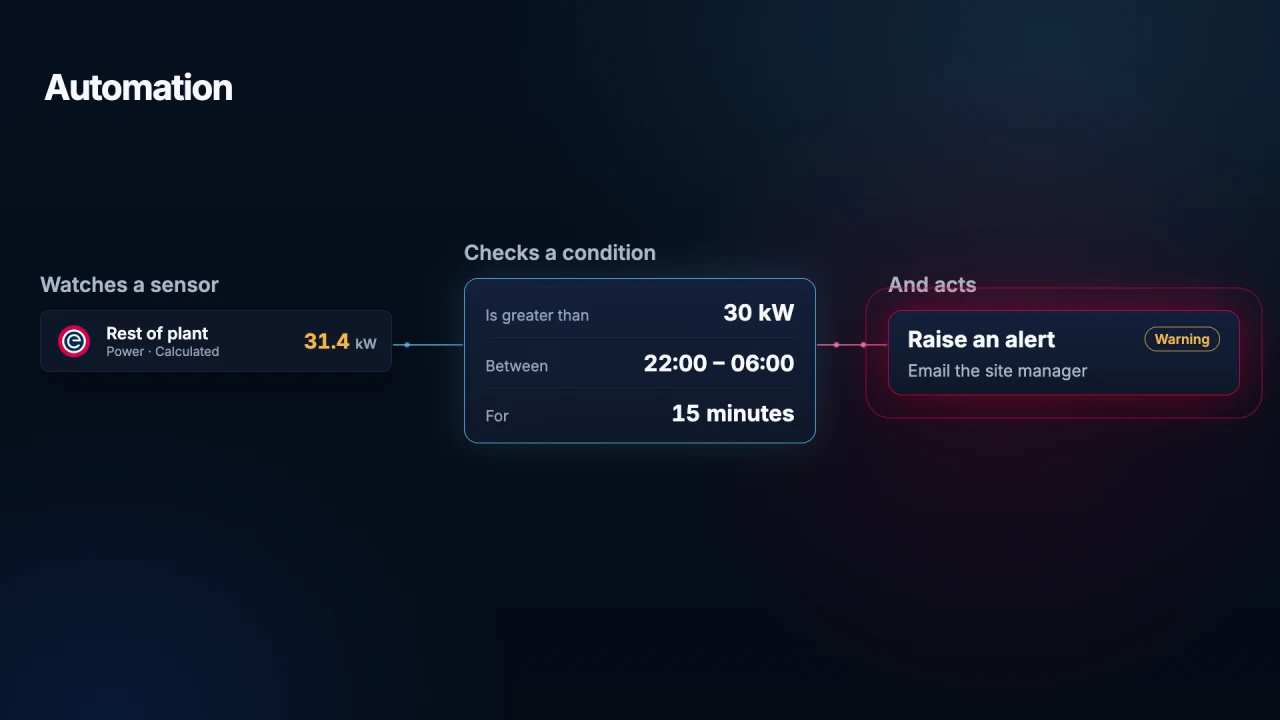
Automation in Edge
Use local Edge automation to monitor a sensor, check a condition and act on it. See how a Gateway alerts staff to unexpected overnight energy use.
Watch video · 1:45 -
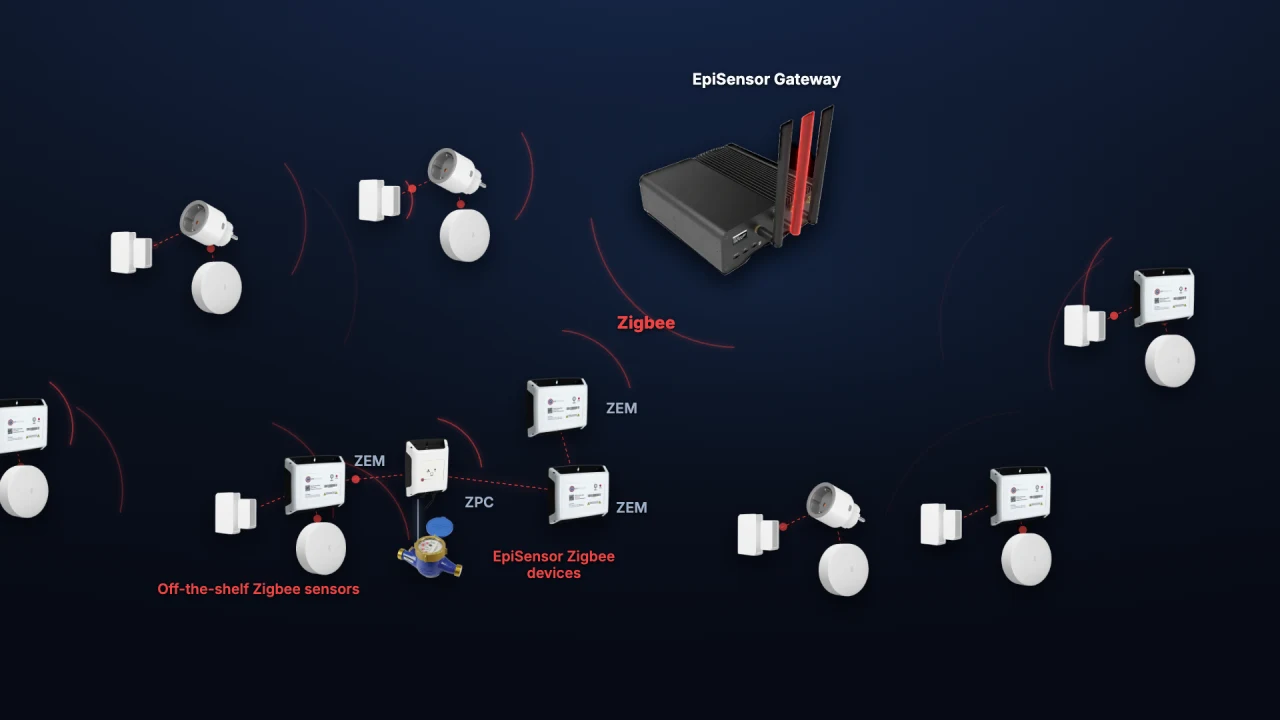
Adding Zigbee devices in Edge
Add a ZEM electricity monitor, door contact and temperature sensor to Edge. See how industrial meters and everyday sensors share one wireless network.
Watch video · 1:59