Energy data analysis in Edge
Find the story behind your energy readings with EpiSensor Edge. This walkthrough uses a compressor running outside its expected hours to demonstrate charts, period comparisons, zoom and heatmaps.
Read the transcript
This month's energy use is running higher than it should, and the answer is already sitting in the data. Edge records every reading from every sensor, and keeps the history right here on the Gateway. Open the Data page and add a visualisation: find the sensor through the site, from the building down to the room, then pick the Mains Incomer and its power. Draw it as a line, an area or bars, in whichever colour you like, then search for Compressor 1 and add it alongside.
Stretch the range to thirty days, and something jumps straight out: for two whole weeks, Compressor 1 never switched off. Drag across to zoom right in, hover for the exact reading, and even in the middle of the night it was drawing over twelve kilowatts. Now compare it on its own against the week before: the dashed line shows it running flat out all night, and this week it's back on its shifts.
Switch to a heatmap, and every night it should have been idle lights up at once. Any chart can go straight onto a dashboard for the whole team to keep an eye on. And all of that history lives on the Gateway itself: it can keep years of it, with an SSD for extra room. Settings shows where every reading goes, as a live diagram: in from Zigbee, the HTTP API and calculated devices, through the proxy into local history, and out to the integrations you've chosen.
You decide what leaves the site, sensor by sensor. Every high-resolution reading stays local for the engineers, while just the totals, like each meter's kilowatt-hours, go out as they're read, for finance and carbon reporting. Integration flows carry them securely: JSON over HTTPS to your own database, BI tool or energy platform, or utility files for a sustainability platform, and if the link drops, readings wait on the Gateway and catch up with their original timestamps.
So engineers on site get every detail, finance and sustainability teams get the numbers they report, and with Core, every site's Gateway comes together in one place. That's Data, in EpiSensor Edge. There's more in the Edge documentation.
Related videos
-
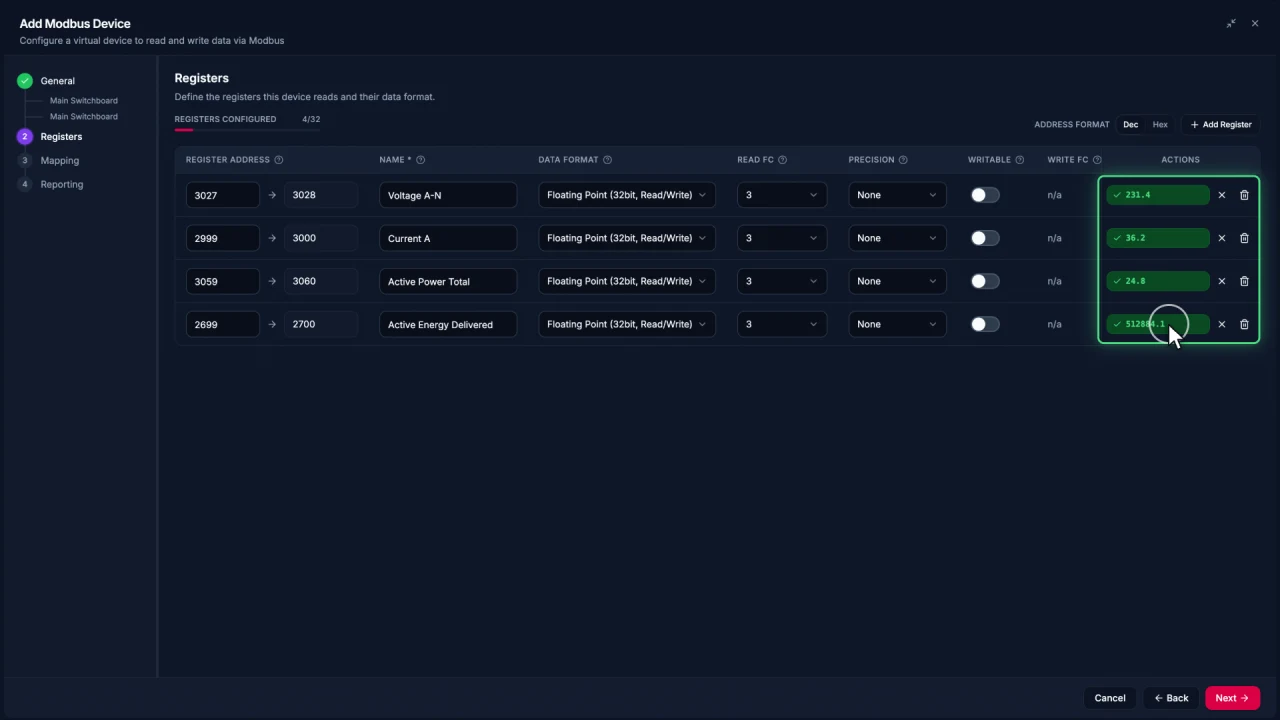
Connecting Modbus meters in Edge
Bring existing meters into your energy management system with EpiSensor Edge. This walkthrough shows how to add a Modbus TCP connection, configure and test registers, and reuse a device template for the next meter.
Watch video · 2:30 -
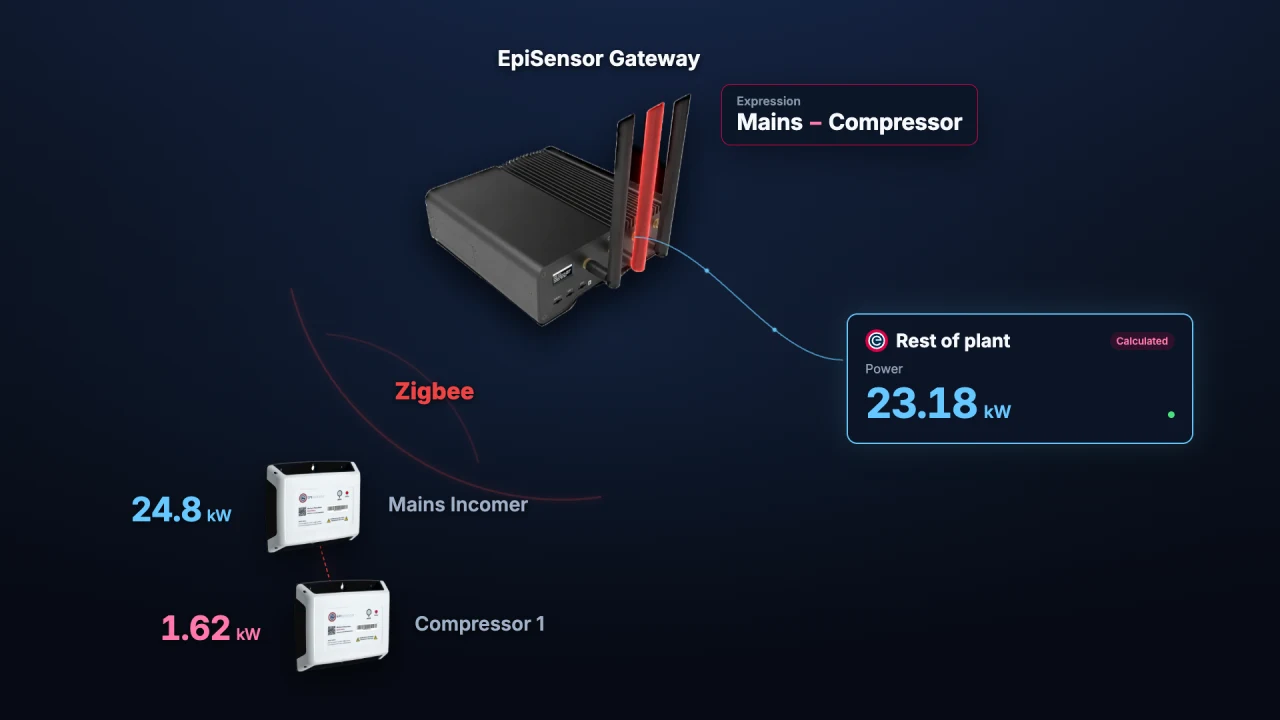
Calculated Devices in Edge
Create new measurements from the sensors you already have. In EpiSensor Edge, a Calculated Device runs an operation on the Gateway and publishes the result as a sensor you can chart, monitor and use in automation.
Watch video · 1:56 -
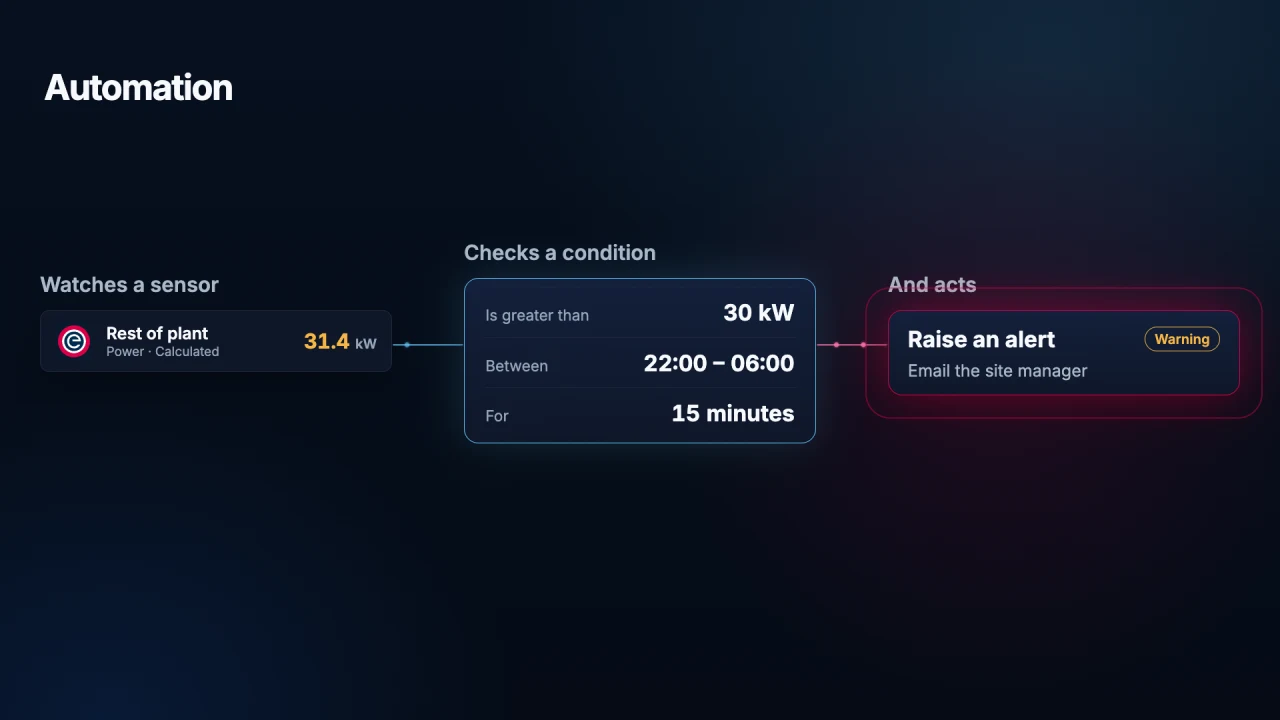
Automation in Edge
Nobody should have to sit and watch an energy dashboard. EpiSensor Edge can monitor a sensor, check a condition and take action, with rules running locally on the Gateway.
Watch video · 1:45 -
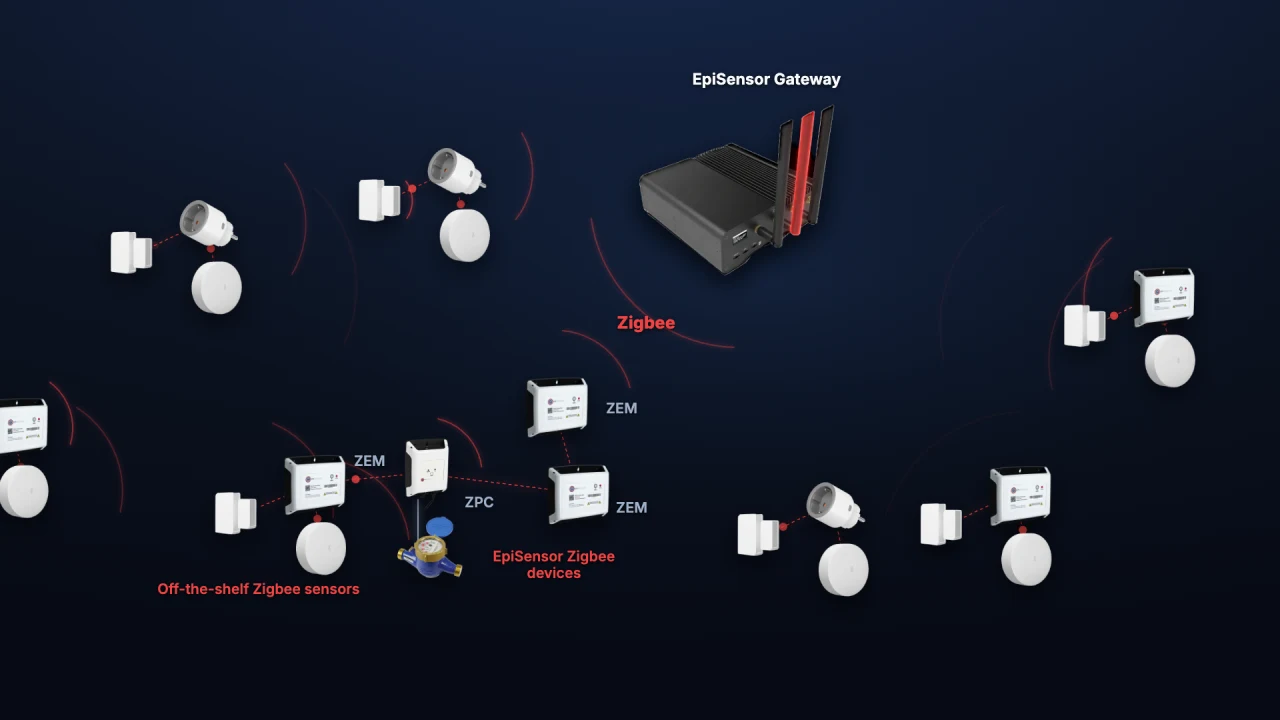
Adding Zigbee devices in Edge
Bring industrial metering and everyday sensor readings together on one wireless network. This walkthrough adds an EpiSensor ZEM electricity monitor, a door contact and a temperature sensor to EpiSensor Edge.
Watch video · 1:59