Energy monitoring payback calculator

Estimate the payback of an energy monitoring system from your energy spend, the saving you expect, and EpiSensor list prices.

Energy cost and demand Updated Free, no sign-up

Example values
Energy spend
€

Your own estimate

%
System

One per three-phase circuit

ZEM-65 with 120 A CTs, list price

€

ZGW-20 Commercial, list price

€
€
More options

€16 a month, billed annually; 0 without support

€
years

Simple payback

19.9months

5% of €120,000 a year, 10 monitors and 1 Gateway.

Saving per year
€6,000
Upfront cost
€9,649
Running cost per year
€192
Net over 5 years
€19,391

Prices exclude VAT. The saving is your estimate: measure a baseline first and verify the saving against it.

How it’s calculated
  1. Saving = spend × saving %=€120,000 × 5%=€6,000
  2. Upfront = monitors + Gateways + installation=10 × €625 + 1 × €899 + €2,500=€9,649
  3. Payback = upfront ÷ (saving − running)=€9,649 ÷ €5,808 a year=1.661 years = 19.9 months

Choose the monitors and Gateway for this site.

Build a system

At a 5% saving on €120,000 a year, a €9,649 system pays back in 19.9 months.

Tip: Start with the biggest loads. Monitoring the ten circuits that make up most of the bill pays back faster than monitoring every circuit.

How to calculate energy monitoring payback

Simple payback is the upfront cost divided by the net saving each year: the saving the monitoring makes possible, less what it costs to run.

The calculator does not predict the saving. You enter it. The 5% default comes from the Carbon Trust advanced metering trial (CTC713, 2007). Its 582 UK sites identified savings of 12.3% on average and implemented 5.1%. Only 56% of the sites acted on at least one recommendation. The meters found the waste; people had to remove it.

Annual saving

Saving = annual energy spend × expected saving %

Enter the spend that the monitored circuits can influence. If the monitors cover the compressor house only, use its share of the bill, not the site total. The percentage is what the site will cut once it can see the load, for example a chiller that runs through the weekend or a compressor that loads all night against leaks.

Upfront cost

Upfront = monitors × price + Gateways × price + installation

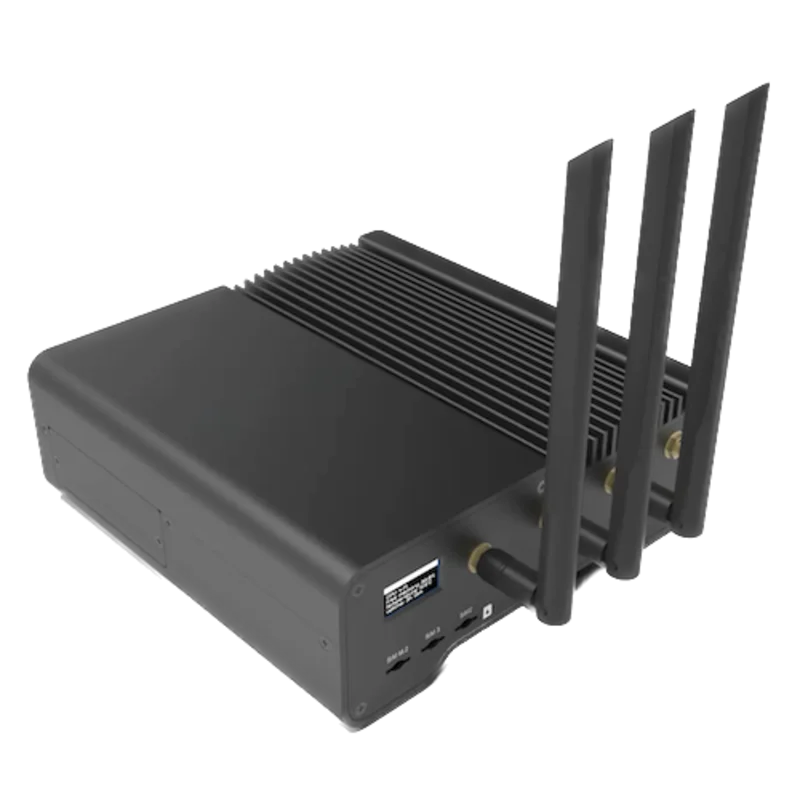
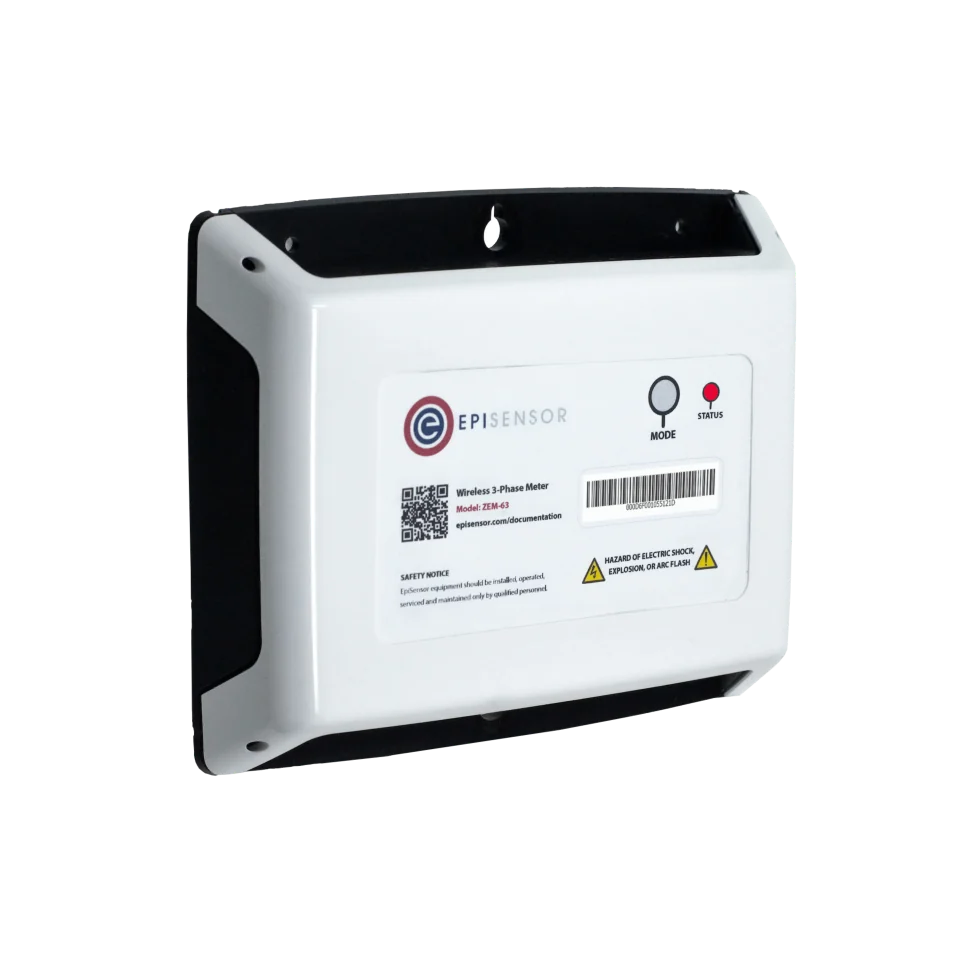
The defaults are EpiSensor list prices excluding VAT: €625 for an electricity monitor with 120 A split-core CTs and €899 for a Gateway. Edge runs on the Gateway with no licence cost for EpiSensor devices. Installation is the figure to get priced for the site. It depends on the number of distribution boards, access, and whether the site rules require isolation for the CT and voltage connections.

Simple payback

Payback = upfront ÷ (saving − running cost)

Running cost is the optional support plan, €192 per Gateway per year (€16 a month, billed annually). Set it to 0 without support. If the saving does not exceed the running cost, the calculator shows no payback. For the ten-circuit example, that happens below a saving of 0.16%.

Net over the period

Net = (saving − running cost) × years − upfront

The period (5 years by default, under More options) sets the horizon. The calculator warns when payback takes longer than the period. For the ten-circuit example, 5 years gives €19,391 after the system has paid for itself, about 3 times its cost.

Simple payback ignores the time value of money, energy price changes and tax. It is good enough to screen a project. A funding case needs the saving verified afterwards against a measured baseline, adjusted for weather and production, as the IPMVP sets out. Record the baseline before you change anything, over a full operating cycle: 12 months where heating or cooling drives the load.

A whole-site meter is a weak test of a 5% saving. IPMVP Core Concepts states that with monthly billing data only, savings typically must exceed 10% of baseline energy to be verified at the whole-facility level (Option C). Interval data can resolve smaller savings. A monitor on the circuit that changed measures the saving directly, which is Option B, retrofit isolation.

Payback examples

A mid-sized site, ten circuits

Ten electricity monitors with 120 A CTs, one Gateway and €2,500 of installation cost €9,649. A 5% saving on €120,000 is €6,000 a year, or €5,808 after €192 of support. The system pays back in 19.9 months and is €19,391 ahead at the end of 5 years.

Simple payback 19.9 months Open in the calculator
A small building, four circuits

A 3% saving is close to what the Carbon Trust trial sites achieved when they received data and no advice. On a €40,000 bill that is €1,200 a year, or €1,008 after support. Against €4,399 upfront, payback is 4.4 years, just inside the 5-year period, with €641 net at the end.

The Gateway and installation are 43% of the cost here, against 35% in the ten-circuit example. A small system carries the same fixed costs over fewer monitors, so a small building needs a higher saving or a longer horizon.

Simple payback 4.4 years Open in the calculator

An industrial site, sixty circuits

Sixty monitors, three Gateways and €15,000 of installation cost €55,197. At 8% of €900,000 the saving is €72,000 a year, €71,424 after support, and the system pays back in 9.3 months.

Compressed air alone can support an 8% figure on a plant that uses a lot of it. The US DOE compressed air tip sheet puts leaks at 20 to 30% of compressor output and gives 5 to 10% of system flow as a practical target. A monitor on the compressor feed shows the leak load. When production stops at the weekend, a compressor that cycles on and off is feeding leaks only. The Compressed Air Challenge leak test (Fact Sheet 7) gives leakage as on-load time × 100 ÷ (on-load time + off-load time). Both times come straight from the current trace.

Simple payback 9.3 months Open in the calculator

Payback table by saving and energy spend

Simple payback in years for the ten-circuit system in the first example (€9,649 upfront, €192 a year of support). The system cost is fixed and the saving scales with spend, so the same 5% pays back in 4.2 years on €50,000 a year and in 0.4 years on €500,000.

Payback table by saving and energy spend, values in years
Saving (%)€50,000 a year (years)€120,000 a year (years)€500,000 a year (years)
211.94.41.0
37.42.80.7
54.21.70.4
82.51.00.2
102.00.80.2
151.30.50.1

Download this table (CSV)

Questions about energy monitoring payback

How much does energy monitoring save?

The Carbon Trust trial measured it: 582 UK sites, 2004 to 2006, 5.1% implemented on average. Sites that received data alone saved the least, about 3%. Sites that also received short emailed recommendations saved the most, 7.5%. Use 3% if nobody has the job of acting on the data, 5% as a default, and more only where you can name the measures and their kWh.

Which circuits should I monitor first?

Start with the loads that should drop when the site is idle: compressors, refrigeration, HVAC plant and process lines. Add the main incomer, so that the unmonitored load is the incomer minus the sum of the circuits. Then rank the remaining circuits by annual cost. At a 5% saving, a €625 monitor pays for itself within a year only on a circuit that costs at least €12,500 a year.

Why do savings fade after the first year?

Most savings from monitoring are operational, and operations drift. A timer is overridden for a late shift and not reset. New leaks open after a leak survey; the DOE tip sheet says that fixing leaks once is not enough. Keep the baseline running after the project, and set an Edge automation to email someone when the out-of-hours load rises above its baseline.

Does the payback include software?

Yes. Edge, the software on the Gateway, has no licence cost for EpiSensor devices. The only running cost is the optional support plan, entered per Gateway per year. Set it to 0 without support.

Can monitoring pay back through demand charges?

Yes, where the tariff charges for peak kW or kVA. This calculator counts an energy saving only. To include a demand saving, add it to the saving percentage as a share of the annual spend: €4,800 a year on a €120,000 bill adds 4 points. The interval demand and electricity cost calculators show the demand part of a bill.

Limits of this result

  • The saving is your estimate. Measure a baseline before changing anything, then verify the saving against it, adjusting for weather and production.
  • Monitoring saves energy only when someone acts on what it shows; the payback assumes they do.
  • List prices exclude VAT, delivery and volume discounts; installation varies with the site.

Measure the energy behind the figure

The calculator’s defaults are one electricity monitor per three-phase circuit and one Gateway running Edge.

Related guides

Sources

  1. EpiSensor hardware list prices (opens in a new tab) EpiSensor, catalogue, valid from January 2026
  2. International Performance Measurement and Verification Protocol (IPMVP) Core Concepts (opens in a new tab) Efficiency Valuation Organization, 2022
  3. Advanced metering for SMEs: carbon and cost savings (CTC713) (opens in a new tab) Carbon Trust, 2007
  4. Minimize compressed air leaks (Compressed Air Tip Sheet 3) (opens in a new tab) (PDF) US Department of Energy, Advanced Manufacturing Office, August 2004