Demand response event calculator

Work out the energy a demand response event delivered against its baseline, how it compares with the commitment, and the rebound afterwards.

Solar, storage and flexibility Updated Free, no sign-up

Event

Common intervals

min
kW

One interval per line: baseline and actual kW, such as 520: 410

After the event

The intervals that follow, to measure the rebound. Leave empty to skip it.

One interval per line: baseline and actual kW, such as 500: 550

Energy reduced during the event

80.5kWh

Average reduction
80.5 kW
Rebound after the event
33.25 kWh
Net reduction after rebound
47.25 kWh
Event length
4 intervals
  • Pass: Commitment met on average80.5 kW average107.3%
Event200 kW250 kW300 kW350 kW400 kW12345678BaselineActual

Import is positive, export negative. The programme’s own baseline and settlement rules decide what is paid.

How it’s calculated
  1. E = Σ(baseline − actual) × t=(80 + 83 + 82 + 77) × 0.25 h=80.5 kWh
  2. Rebound = Σ(actual − baseline) × t, after the event=(60 + 42 + 21 + 10) × 0.25 h=33.25 kWh

Choose the devices for a demand response site.

Build a system

Against its baseline, the site cut 80.5 kWh over 4 intervals, an average of 80.5 kW or 107.3% of the commitment, and took back 33.25 kWh afterwards.

Tip: Rebound matters to a flexibility buyer as much as the event: heating and cooling loads often take the energy back in the next hour.

How to measure a demand response event

A demand response event is measured against a baseline: what the site would have used had there been no event. The energy delivered is the difference between baseline and actual demand in each interval, added up over the event. A site 106.25 kW below its baseline on average for an hour has delivered 106.25 kWh, displayed as 106.3 kWh; if it then uses 20 kWh more than its baseline to catch up, the net effect is 86.25 kWh.

Energy delivered

E = Σ (baseline − actual) × interval hours

For each interval of the event, subtract the metered demand from the baseline demand, in kW, and multiply by the interval’s length in hours. A 15-minute interval is 0.25 h. Import is positive and export negative, so a site that exports during the event delivers more than its whole load.

Against the commitment

Delivery (%) = average reduction ÷ committed reduction × 100

Most programmes pay for a committed reduction in kW. Meeting it on average is not always enough: many settle each interval separately, so an interval below the commitment can cost money even when the average is above it. The calculator counts those intervals.

Rebound

Rebound = Σ (actual − baseline) × interval hours, after the event

Loads that store energy, such as heating, cooling and refrigeration, catch up after the event and use more than their baseline for a while. The grid operator sees that rebound as new demand, so it matters to the value of the flexibility as much as the event itself.

The baseline is the part that decides what is paid, and it belongs to the programme, not the site. Common methods average the same hours on recent similar days, often adjusted to the site’s demand just before the event, or fit a model of demand against temperature. The arithmetic here is the same whatever baseline the programme uses; enter its baseline values and the metered values interval by interval.

Demand response event examples

An hour-long event with rebound

Four 15-minute intervals with reductions of 110, 110, 95 and 110 kW deliver exactly 106.25 kWh, displayed as 106.3 kWh, and average 106.25 kW against a 100 kW commitment. The third interval fell short, which matters if the programme settles each interval. Over the next half hour the site took back 20 kWh.

Energy reduced during the event 106.3 kWh Open in the calculator
A two-hour event that fell short

The site started 250 kW below its baseline but drifted back over two hours. It delivered 370 kWh, an average of 185 kW, or 92.5% of its 200 kW commitment, with three of the four half-hours below it. A load that recovers during an event, such as a chiller whose building warms up, often shows this shape.

Energy reduced during the event 370 kWh Open in the calculator

Refrigeration, and the energy it takes back

Cold stores switched off for an hour cut 80.5 kWh against a 75 kW commitment. When they restart they pull the temperature back down, using 33.25 kWh above the baseline over the next hour, so the net reduction is 47.25 kWh.

Energy reduced during the event 80.5 kWh Open in the calculator

Energy delivered by reduction and event length

Energy delivered in kWh for a reduction held steady for the whole event, with no rebound.

Energy delivered by reduction and event length, values in kWh
Reduction (kW)30 minutes (kWh)1 hour (kWh)2 hours (kWh)4 hours (kWh)
2512.52550100
502550100200
10050100200400
200100200400800
5002505001,0002,000
1,0005001,0002,0004,000

Download this table (CSV)

Questions about demand response events

What is a demand response baseline?

An estimate of what the site would have used during the event had it not responded. The programme defines how it is calculated, usually from the same hours on recent similar days. Because nobody can meter what did not happen, the baseline method decides what the site is paid for.

Why does the interval length matter?

Settlement uses the programme’s own interval, often 15 or 30 minutes, and a reduction that dips within an interval shows only as its average. Metering at the same interval, or shorter, lets the site see what the programme sees.

Is rebound always bad?

Not always. A programme that asks for a reduction at the evening peak may not care about extra demand at midnight. It matters when the rebound lands in another peak, and some programmes limit it for that reason.

How is a demand response event measured in practice?

With interval metering at the site’s connection, or on the loads that respond, and a controller that acts on the operator’s signal. See the role of IoT in demand response.

Limits of this result

  • This does not set or approve a baseline; use the one the programme calculates.
  • Weather, production, occupancy and advance notice can require the baseline to be adjusted.
  • Enter equally spaced intervals, in time order, as average kW with import positive and export negative.

Measure it continuously

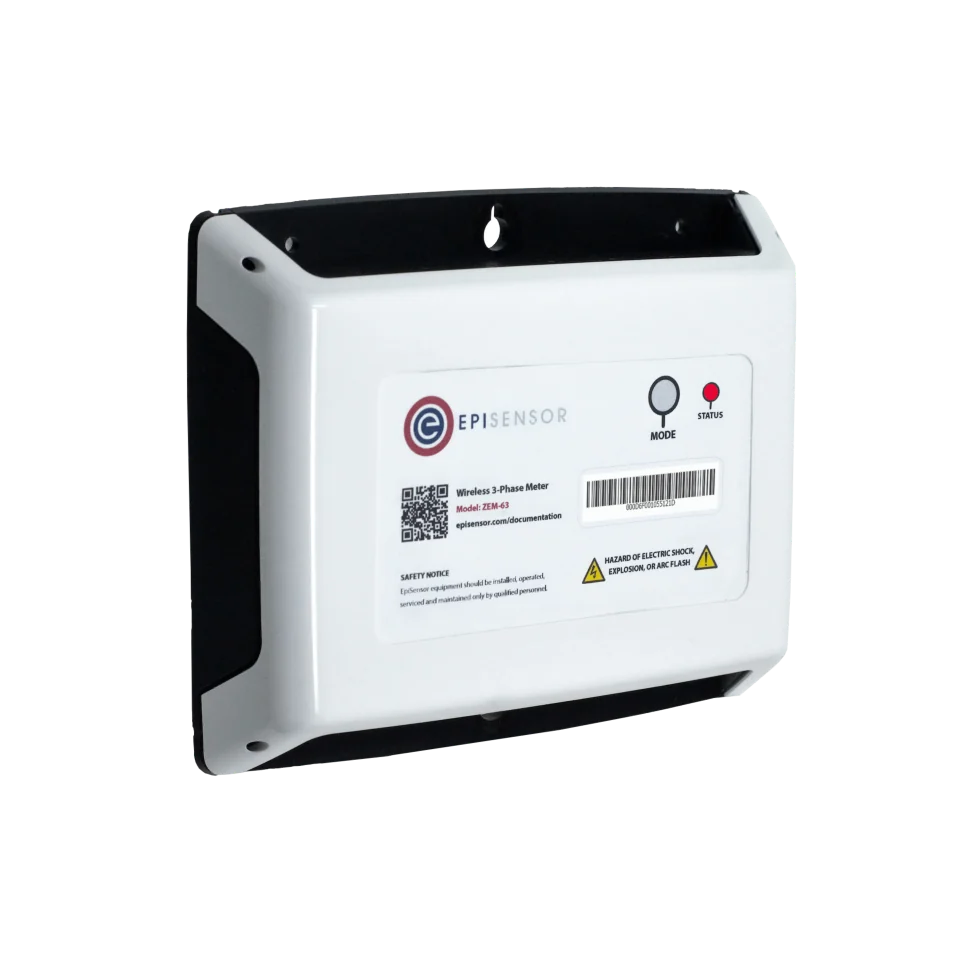
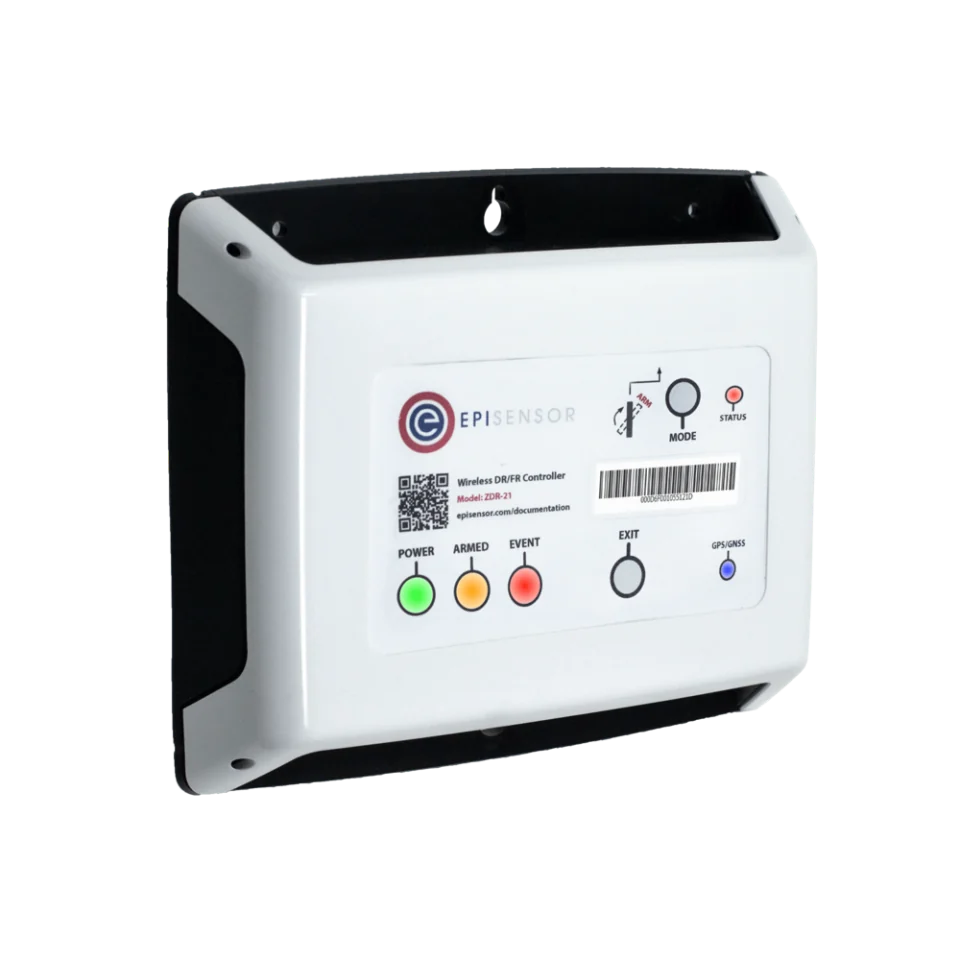
A ZDR measures three-phase demand and switches loads locally when an event starts; a ZEM meters the other circuits, so both the response and the baseline come from the same data.

Related guides

Sources

  1. Measurement and Verification for Demand Response (opens in a new tab) (PDF) US Department of Energy and Federal Energy Regulatory Commission, Final report, 2013-02
  2. Demand response application guide (opens in a new tab) EpiSensor, current website application record