An office over a 30-day month
36,000 kWh ÷ 720 h is an average of 50 kW. Against a 100 kW peak, the load factor is 50%: the building runs hard in working hours and lightly at night and at weekends.
Load factor 50 % Open in the calculator
Work out how evenly a site uses its peak demand over a billing or reporting period, from energy used and the peak interval demand.
Load factor
50%
Check the values to see a result.
For the entered period only. Compare periods that use the same demand interval.
Load factor = E ÷ (Ppeak × t) × 100
36,000 kWh over 720 hours with a 100 kW peak is an average of 50 kW, a load factor of 50%.
Tip: A low load factor means short, sharp peaks: the case where peak shaving or load shifting pays back fastest.
Load factor compares the energy a site actually used with the energy it would have used running at its peak demand the whole time. Divide the kWh by the peak kW times the hours in the period. A site that used 36,000 kWh in a 30-day month with a 100 kW peak averaged 50 kW, a load factor of 50%.
LF = E ÷ (Ppeak × t) × 100
E is the energy in kWh, Ppeak the highest demand in kW and t the length of the period in hours. All three must cover the same period.
Pavg = E ÷ t
Load factor is the average demand as a share of the peak: 50 kW average against a 100 kW peak is 50%.
hours at peak = E ÷ Ppeak = LF × t
The same idea read the other way: how many hours at full peak would use the period’s energy. Over a year, 4,380 hours is a load factor of 50%.
Peak demand depends on the interval it is measured over. A 15-minute peak is higher than a 30-minute one for the same load, so compare load factors that use the same interval.
36,000 kWh ÷ 720 h is an average of 50 kW. Against a 100 kW peak, the load factor is 50%: the building runs hard in working hours and lightly at night and at weekends.
Load factor 50 % Open in the calculator
186,000 kWh over 744 hours averages 250 kW. With a 400 kW peak the load factor is 62.5%. If the peak comes from several large motors starting together, staggering them lowers the peak and the demand charge without changing the energy.
Load factor 62.5 % Open in the calculator
1,500,000 kWh in a year with a 650 kW peak is an average of 171.2 kW, a load factor of 26.34%. Most of the time the site uses a quarter of the capacity it pays for, which makes it a strong case for peak shaving or load shifting.
Load factor 26.34 % Open in the calculator
Annual energy divided by the annual peak gives full-load hours. This table converts them to load factor and to average demand per 100 kW of peak.
| Full-load hours per year | Load factor (%) | Average kW per 100 kW of peak |
|---|---|---|
| 500 | 5.7 | 5.7 |
| 1,000 | 11.4 | 11.4 |
| 2,000 | 22.8 | 22.8 |
| 3,000 | 34.2 | 34.2 |
| 4,000 | 45.7 | 45.7 |
| 5,000 | 57.1 | 57.1 |
| 6,000 | 68.5 | 68.5 |
| 7,000 | 79.9 | 79.9 |
| 8,000 | 91.3 | 91.3 |
| 8,760 | 100.0 | 100.0 |
It depends on the site. Continuous processes and data centres often run above 70%. Offices and schools sit well below, because they are busy only part of the day. What matters is the trend and the cause of the peak.
Networks and tariffs charge for peak capacity as well as energy. A low load factor means paying for capacity that sits idle most of the time, and it often shows a peak that could be moved or trimmed.
Lower the peak rather than the energy: stagger large loads, shift flexible ones such as heating, cooling or charging away from the peak, or respond to demand signals. The demand response event calculator checks what a reduction delivered.
The highest interval demand in the same period as the energy, measured the way your tariff measures it. The interval demand calculator turns interval kWh into kW.
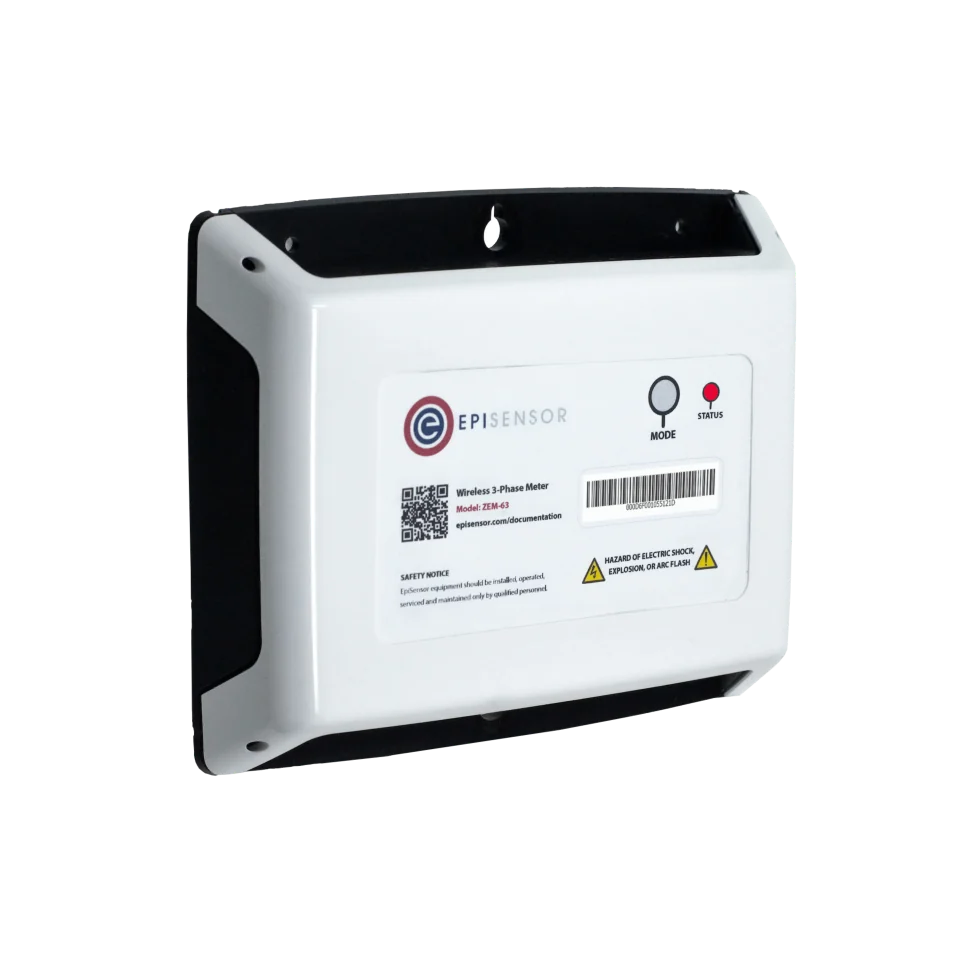
Load factor needs a true peak. A ZEM records demand continuously, so the peak interval and what caused it are both on record.