Heat pump COP calculator

Work out a heat pump’s COP at one moment, or its performance factor over a period, from the heat it delivers and the electricity it uses.

HVAC, thermal and process Updated Free, no sign-up

Example values
What do you want to calculate?
Basis
Measurements
kW
kW

Pumps, backup heater; 0 to exclude

kW

COP, heating

3

Without the auxiliaries
3.333
Auxiliaries’ share of the electricity
10%
Electricity in total
100 kW

Heat and electricity must be measured over the same interval.

How it’s calculated
  1. COP = Q ÷ (Pheat pump + Paux)=300 ÷ (90 + 10) kW=3

Choose the devices to monitor this heat pump.

Build a system

300 kW of heat for 100 kW of electricity is a COP of 3.

Tip: Include backup heaters and circulation pumps when you compare against a seasonal figure; leaving them out flatters the result.

How to calculate heat pump COP and SPF

COP is the heat a heat pump delivers divided by the electricity it uses, at one operating point. The same ratio of energy totals over a whole heating season is the seasonal performance factor (SPF), and the SPF sets the running cost. Neither figure can be compared with another until you state which electricity is inside the boundary. A unit that delivers 300 kW of heat for 90 kW has a COP of 3.333. Add 10 kW for its circulation pumps and the COP is 3.

COP now

COP = heat delivered (kW) ÷ electrical input (kW)

Average heat and electricity over the same interval, on one clock. COP moves with the source temperature, the flow temperature, the load and defrost. Record the outdoor and flow temperatures with each reading, because one reading describes only those conditions.

Over a period

SPF = heat delivered (kWh) ÷ electricity used (kWh)

Use the change in the heat meter register and in the electricity meter register between the same start and end readings. Over a full heating season the result is the SPF. Over a week or a month it is a performance factor for that period. It is good for trends, but a mild month reads higher than the season.

Auxiliaries

Electrical input = heat pump + included auxiliaries

The SEPEMO field-trial project defined four boundaries. H1 is the compressor and controls. H2 adds the source fan or brine pump. H3 adds the backup and immersion heaters. H4 adds the heating-side circulation pumps. On an air-source monobloc, the outdoor unit’s supply feeds the compressor and the fan, so that meter alone gives H2. Enter the backup heater and the circulation pumps as auxiliaries to get H4. At H3 and H4 the heat meter must also count the backup heater’s output.

Datasheet COP and SCOP figures come from EN 14825 tests at fixed conditions. SCOP weights those test points over a reference heating season for an average, colder or warmer climate, at 35 °C or 55 °C flow. A measured SPF on a real building is usually lower. The Electrification of Heat trial, run by Energy Systems Catapult, monitored 742 heat pumps in UK homes from 2020 to 2022. Its median air-source SPF at H4 was 2.80, and 2.44 on the coldest days.

Flow temperature is the largest factor you can change on site. The ideal (Carnot) COP is T_flow ÷ (T_flow − T_source), in kelvin. With a 0 °C source it falls from 8.8 at 35 °C flow to 6.0 at 55 °C, a loss of about 2% for each kelvin. Real machines reach a roughly constant fraction of the ideal over this range, so the same ratio applies. Heating at 55 °C instead of 35 °C costs about a third of the COP.

The heat meter sets the accuracy. Under MID Annex MI-004, a class 2 heat meter at a tenth of its permanent flow and a 5 K temperature difference may be out by 5.6%, mostly from the temperature pair. Heat pumps often run at 5 K or less. A true COP of 3.0 can therefore read from 2.8 to 3.2 before the electricity meter adds its own error of about 1%. Compare a system with its own trend, and ignore the second decimal. The heat meter data guide sets out the error terms.

Heat pump COP and SPF examples

A COP reading on a commercial heat pump

300 kW of heat for 90 kW to the heat pump and 10 kW to its circulation pumps is a COP of 300 ÷ 100 = 3. The heat pump on its own reaches 3.333. Check the pumps’ share over a day as well. A fixed-speed pump that runs while the compressor is off takes a larger share of the day’s energy than of any single reading.

COP, heating 3 Open in the calculator
A heating season with the circulation pumps

Over one heating season the heat meter recorded 24,000 kWh. The heat pump used 7,000 kWh and its circulation pumps 600 kWh, so the SPF is 24,000 ÷ 7,600 = 3.158. This is an H4 figure only if no backup or immersion heater ran during the season.

Performance factor for the period 3.158 Open in the calculator

The same season with the backup heater counted

The backup heater did run in cold weather, and used 1,500 kWh on its own circuit. It sits upstream of the heat meter, so the 24,000 kWh already includes about 1,500 kWh of its heat. With the heater counted, the auxiliaries total 2,100 kWh and the SPF is 24,000 ÷ 9,100 = 2.637.

The heat pump itself delivered 22,500 kWh for 7,000 kWh, a ratio of 3.21. At that ratio the heater’s 1,500 kWh of heat would have cost about 470 kWh. Meter the backup heater on its own circuit. When its share rises, check its setpoint and the outdoor temperature at which it is allowed to switch on.

Performance factor for the period 2.637 Open in the calculator

How auxiliaries lower a heat pump’s COP

The combined COP for each heat-pump-only COP, when the auxiliaries add a percentage on top of the heat pump’s own electricity.

Auxiliaries (% of heat pump electricity)COP 2.5COP 3COP 3.5COP 4COP 5
02.533.545
52.3812.8573.3333.814.762
102.2732.7273.1823.6364.545
152.1742.6093.0433.4784.348
202.0832.52.9173.3334.167
301.9232.3082.6923.0773.846
501.66722.3332.6673.333

Download this table (CSV)

Questions about heat pump COP

What is the difference between COP, SCOP and SPF?

COP is one operating point. SCOP is a seasonal figure calculated to EN 14825 from test points and a reference climate, and it is the figure behind the ErP energy label. SPF is measured on a real installation over a real season. Quote an SPF with its boundary, H1 to H4.

What is a good SPF?

At H4, the median air-source heat pump in the UK Electrification of Heat trial reached 2.80. A system designed for 35 °C to 45 °C flow should beat that. A system that runs radiators at 55 °C or more will struggle to reach it. Ground-source systems usually hold up better in winter, because the ground loop does not follow the coldest days. Compare two SPFs only at the same boundary.

Why is my measured COP lower than the rated one?

Look at 1-minute or 5-minute interval data for three signatures. Defrost shows as heat flow falling to zero or below for a few minutes while the compressor still draws power, most often between 0 °C and 5 °C in damp weather. Short cycling shows as compressor runs of under 10 minutes, several times an hour, usually on mild days when the load is below the unit’s minimum output. Backup heat shows as power on the heater circuit at outdoor temperatures where the heat pump alone should cope.

What do I need to measure heat pump performance?

Put an electricity meter on each circuit inside your boundary, with the backup heater on its own circuit. Put a heat meter on the heat pump’s flow, downstream of any in-line backup heater. Read both on the same interval, and log the outdoor temperature and operating mode with them. See heat pump performance monitoring for a complete system.

Limits of this result

  • Heat and electricity must cover the same period and the same equipment.
  • A COP reading does not show defrost, cycling, backup heat or the season’s weather.
  • A performance factor built on estimated heat is only as good as the estimate.

Measure it continuously

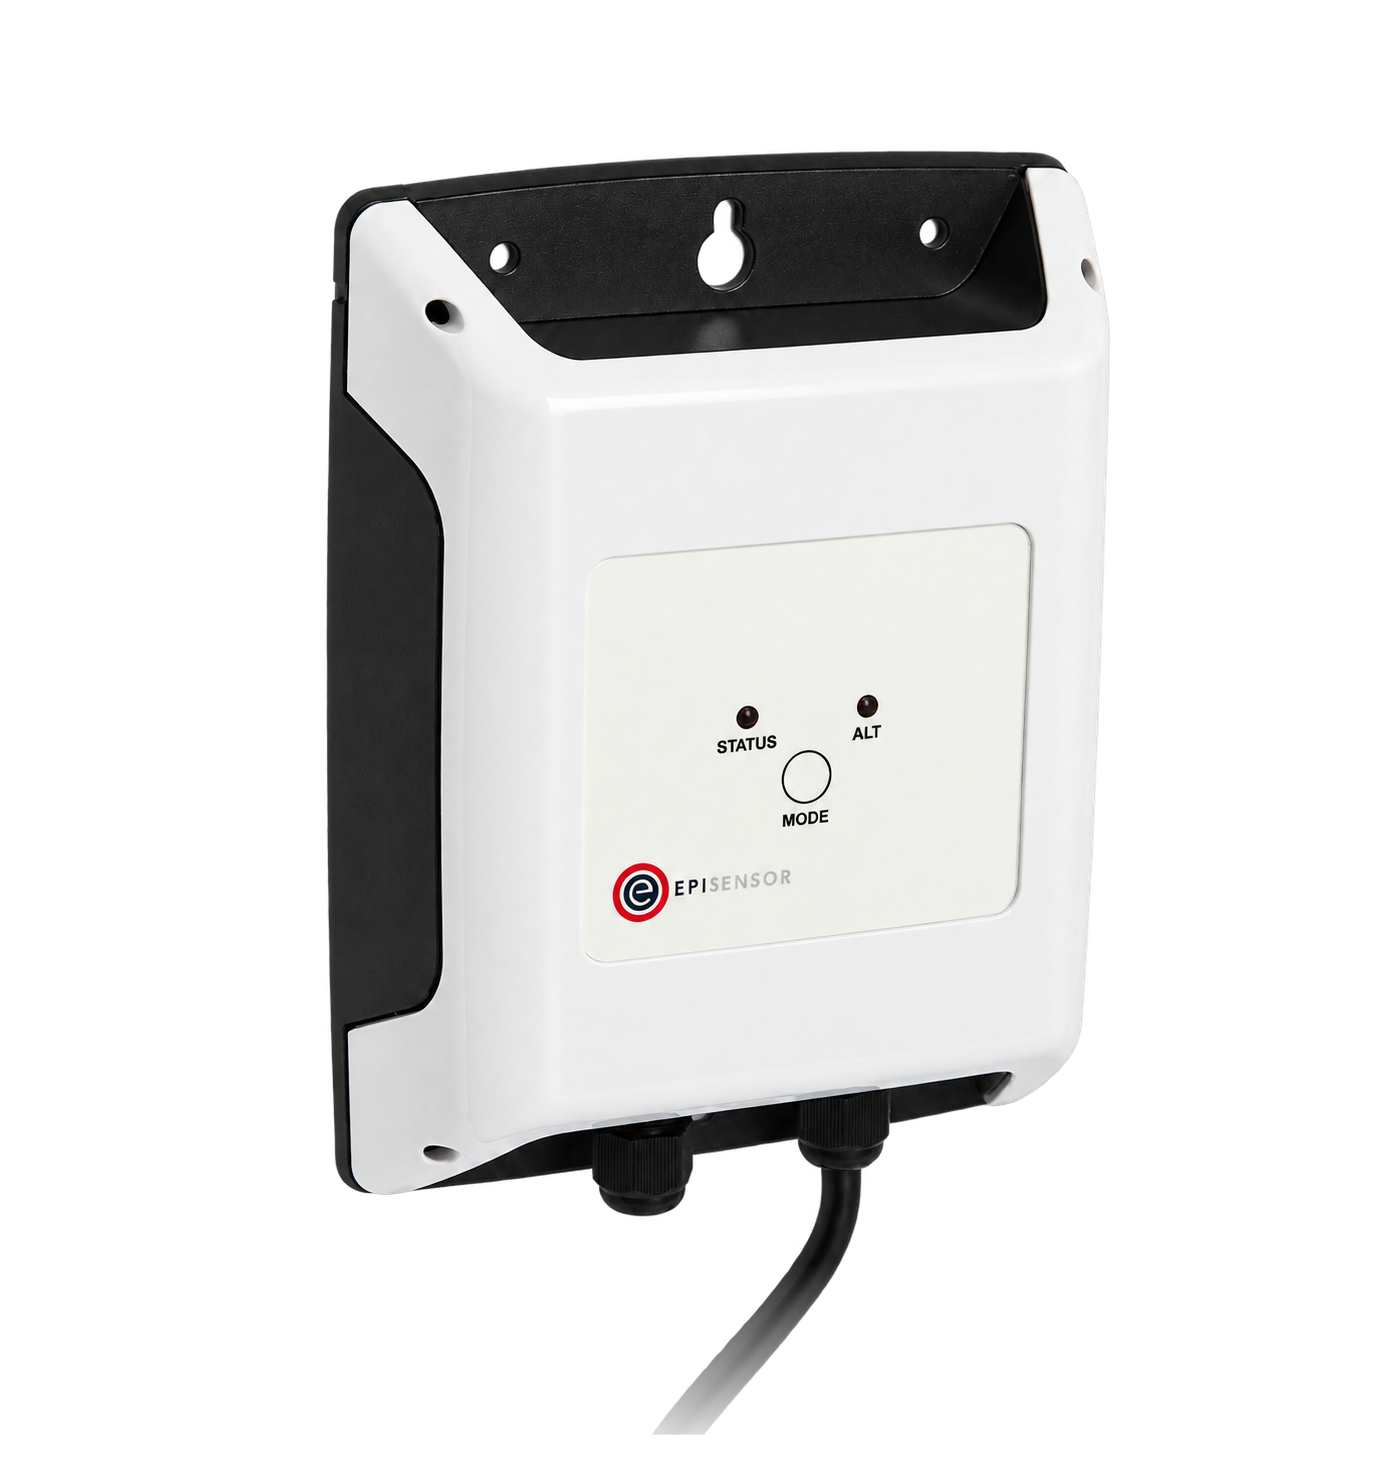
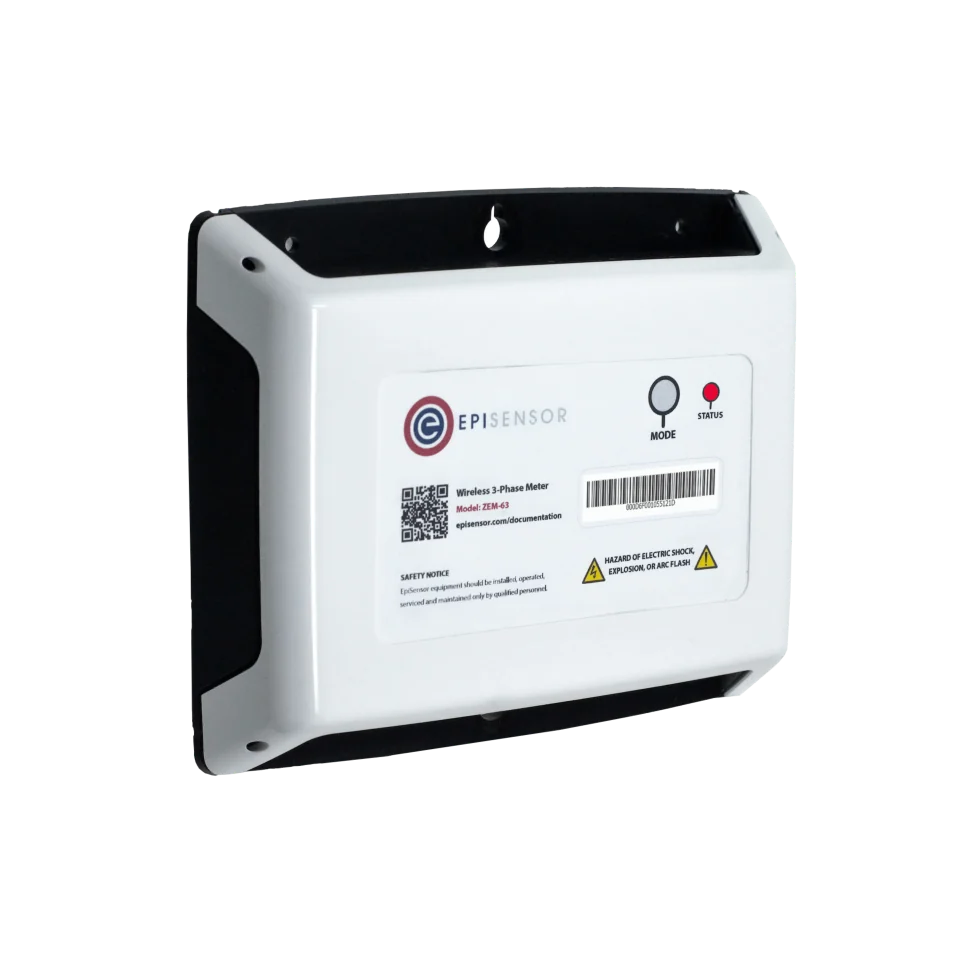
A ZEM measures the electricity to the heat pump and to its auxiliaries. A ZHM reads the heat meter over its M-Bus port for the heat delivered.

Related guides

Sources

  1. Industrial Heat Pumps for Steam and Fuel Savings (opens in a new tab) (PDF) US Department of Energy, BestPractices technical brief
  2. Decarbonizing Building Thermal Systems (opens in a new tab) (PDF) US Department of Energy Better Buildings, 2024