
A SCADA (supervisory control and data acquisition) screen shows what devices report, and a command asks for a change. Neither one proves that the equipment reached the new state. That proof needs its own evidence, and most of this guide is about how to collect it.
What SCADA is
NIST describes SCADA systems as collecting data from geographically remote field stations, and sending commands to them, from a central location. It separates that supervisory role from the local control loops of sensors, controllers and actuators (NIST SP 800-82 Rev. 3).
An energy SCADA stack has these layers, from the plant up:
A local controller can continue its logic during a WAN outage only if its required inputs and authority remain available locally. Verify the loss-of-communications behaviour of each command path; a local controller alone does not establish a safe plant state. The site design must define interlocks, fallback and recovery for a slow or absent WAN.
The timescales show why. A ZDR-2X demand response controller samples grid frequency every 100 ms or faster and reacts within 100 ms. It streams 1-second data through the Gateway to the aggregator's platform (ZDR-2X datasheet). The platform supervises the response, but it has no part in the 100 ms decision. In the Australian NEM, AEMO's central regulation control sends its signals through SCADA on a 4-second cycle, and the fast contingency services respond to local frequency instead (FCAS guide). The ZGW-20 Gateway follows the same rule: Edge runs its automation on the Gateway, so the rules keep running when the internet link is down.
SCADA vs BMS vs EMS
Suppliers use these three names loosely, so a name alone is a poor specification. State which system owns each writable point.
| System | Primary responsibility | Typical scope | Typical outputs | Main boundary |
|---|---|---|---|---|
| SCADA | Operational supervision and data acquisition | Industrial processes, utilities or geographically distributed assets | Live state, alarms, trends, commands and event records | Does not by itself prove physical response or energy savings |
| BMS or BAS | Building equipment automation | HVAC, lighting, access and other building services | Schedules, setpoints, equipment status and alarms | Usually focused on building systems rather than portfolio-wide energy analysis |
| EMS or EMIS | Energy analysis and performance management | Buildings, campuses or portfolios | Normalised energy data, KPIs, benchmarking, fault analysis and measurement workflows | May consume SCADA or BMS data without owning real-time control |
ASHRAE's BACnet material places building automation around applications such as HVAC, lighting, safety, security and energy management (ASHRAE BACnet). The U.S. Department of Energy defines energy management information systems more broadly as software tools that monitor, analyse and sometimes control building energy use, with integration, historian, application and supervisory-control components (DOE EMIS overview).
One site often runs all three. The BMS controls the air-handling units. SCADA supervises the switchgear, generators and site status. The EMS combines meter, tariff and weather data to find savings and verify them.
Give each writable point one owner. If the BMS and SCADA can both write the supply-air setpoint of an air-handling unit over Modbus, the last writer wins, and neither system knows. BACnet gives each commandable property a priority array of 16 slots. The highest slot that is not NULL sets the present value, and Relinquish_Default applies when every slot is NULL (OPC 30030, 3.2.1). This causes a quiet failure. A SCADA write at priority 10 gets a successful WriteProperty response, but the value does not change while the BMS holds priority 8. After each write, read back Present_Value and, where the device exposes it, Priority_Array.
Choosing a protocol
Two devices that both support Modbus must still agree on register addresses, data types, scaling, word order, units and behaviour after a link failure. The multi-vendor IoT interoperability guide decodes a meter point in each word order and gives a supplier schedule and a twelve-step acceptance test.
| Protocol | Good fit | Important implementation decision |
|---|---|---|
| Modbus TCP or RTU | Simple register-level acquisition and control where the device map is stable | Register addressing, scaling, signed values, word order and exception handling. Modbus/TCP on port 502 has no authentication. MODBUS/TCP Security is a separate specification that uses TLS and X.509v3 certificates on port 802 (IANA, Modbus specifications). Do not assume it from basic Modbus/TCP support. It does not apply to serial Modbus RTU. |
| BACnet/IP | Integration with building automation objects, schedules, alarms and trends | Specify the required objects, properties, services, command priorities and device profiles. "BACnet compatible" is not a complete point or conformance specification (ASHRAE Standard 135 resources). |
| OPC UA | Typed information models, status, timestamps, alarms, subscriptions and richer system integration | Agree namespace ownership, certificates, supported profiles and information models. Each subscription notification message carries a sequence number, so a client can detect a gap and ask for the missed message with the Republish service (OPC UA Part 4, 5.14.1.1). Test what the application does after a gap. |
| MQTT | Decoupled publish/subscribe telemetry across constrained or intermittent links | Define topic ownership, payload schema, retained-message policy, session behaviour, expiry, ordering and deduplication. MQTT quality of service applies separately to each sender-to-receiver leg, such as publisher to broker and broker to subscriber. It does not cover the complete business workflow (MQTT 5.0). |
The protocol guides go further: Modbus TCP vs RTU, BACnet vs Modbus, OPC UA vs MQTT vs Modbus and MQTT QoS and retained messages. For grid telecontrol, see IEC 60870-5-101 vs 104 and IEC 61850.
Give every point enough context to check it. For a site import meter, one point record looks like this:
| Field | Example |
|---|---|
| Asset | Main LV incomer |
| Point | site/import_active_power |
| Source | ZEM-65 on the incomer, through the ZGW-20 Gateway |
| Unit and sign | kW, import positive |
| Source timestamp | 2026-09-23T14:02:00Z, when the meter took the reading |
| Ingestion timestamp | 2026-09-23T14:02:01Z, when the historian stored it |
| Quality | Good, stale or bad |
| Expected interval | 60 s, stale after 180 s |
OPC UA carries most of this by design. Its DataValue holds the value, a status code, a source timestamp and a server timestamp. The specification requires a client to check at least the severity of the status code before it uses the value (OPC UA Part 4, 7.11). When a gateway copies an OPC UA value into a plain Modbus register, the status and both timestamps are lost. A stale value then looks current.
Multi-site architecture
At each site, a gateway collects wireless and wired measurements, translates protocols and buffers data while the uplink is down. On the ZGW-20 Gateway, Edge reads third-party equipment as a Modbus TCP and RTU client, a BACnet/IP client and an OPC UA client. It sends data onward over MQTTS or HTTPS, or writes it to files. A SCADA master that polls can read Edge's Modbus server, which listens on TCP port 10502 by default. Edge's OPC UA extension is a client only, so a SCADA system cannot browse Edge over OPC UA. The cloud API vs local gateway guide compares a local gateway with reading equipment through a manufacturer's cloud.
A Modbus register holds the last value written to it. If a meter stops reporting, the Edge Modbus server keeps its last reading in the register, and a SCADA poll every 5 s keeps getting that value with no error. A steady 42.7 kW looks the same as a dead source. Edge's max_age setting rejects samples that are already old when they arrive, but it does not expire a register. Map a source heartbeat or acquisition timestamp with a documented update interval and alarm when it stops advancing. An import energy counter is only a conditional cross-check: under independently confirmed steady import of 40 kW, 0.1 kWh resolution gives a step every 9 s. No change for 60 s warrants investigation, but zero load or export can also leave that counter unchanged; it does not alone prove source failure.
For multi-site monitoring, use one semantic model above the gateways and keep the raw source identity below it. A portfolio point such as site/import_active_power must stay traceable to its physical meter, source register or object, unit conversion and acquisition time. Otherwise, a plausible chart can hide a swapped phase, a wrong multiplier or a replayed value.
Buffered data needs a replay rule. When a delivery fails, Edge puts the batch in a disk-backed retry queue and checks once a minute for the destination to recover. Replayed measurements keep their original timestamps, and Edge does not run calculations or automation on them again. A batch can arrive twice if the destination stored it before Edge recorded the delivery. Key historian samples on point ID and source timestamp, and discard an exact repeat. A historian that stamps samples with their arrival time stores a 30-minute outage as 30 minutes of readings in the minute after recovery. The load profile then shows a gap followed by a false peak.
Energy use cases
Demand and interval energy
Tariffs and settlement use energy per interval, not instantaneous power. Take interval energy from the meter's energy counter. If the import counter reads 104,512.0 kWh at 14:00 and 104,698.5 kWh at 14:30, the interval used 186.5 kWh, which is an average demand of 373 kW. An average of instantaneous kW samples taken once a minute is only an estimate. A gap in the samples biases it, and the counter delta is correct across the gap. Use instantaneous power for operations and alarms, and counter deltas for billing and savings verification. Counter rollover and float resolution are covered in the interoperability guide.
Demand response
The aggregator's platform sends an event, the site controller switches the load, and a meter proves the reduction. The next section works through one event. For frequency services, the response itself is local: the ZDR-20 and ZDR-21 switch a relay, and the ZDR-22 sends a set point to a battery over Modbus. SCADA records and reports the event.
Portfolio aggregation
A portfolio total is valid only when every site's sample is current. If one site's last good value is 20 minutes old, show the total as incomplete and name the site. Do not add the old value silently. To order events across sites, the clocks must agree. The ZDR-21 and ZDR-22 record events at 20 ms intervals with GPS time, so their event records from different sites can be compared directly.
Command acknowledgement
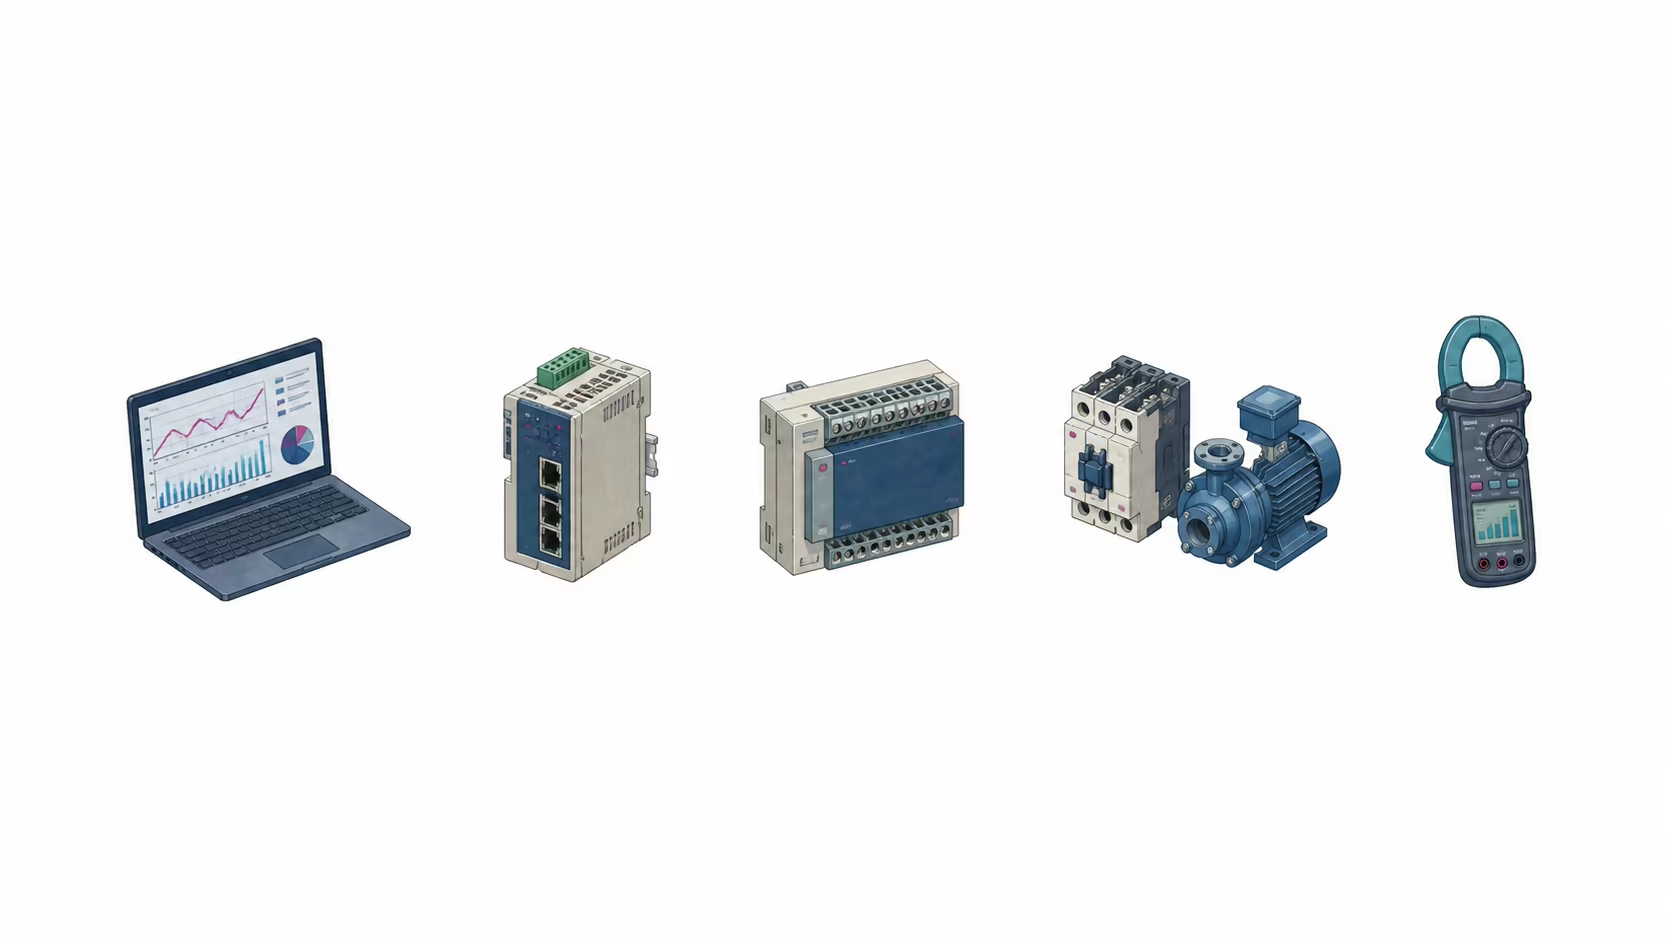
- Request authorised
- Endpoint accepted
- Controller processed
- State verified
- Outcome measured
Record each command against these five stages:
| Evidence stage | What it proves | What it leaves open |
|---|---|---|
| Request authorised | The requester passed the access policy, and SCADA logged the request with a command ID | Whether the command left the SCADA server |
| Endpoint accepted | A named protocol endpoint, such as an MQTT broker, took responsibility for the message | Whether a subscriber, controller or device acted |
| Controller processed | The target controller accepted the command after its own checks | Whether the plant changed |
| State verified | Equipment feedback, such as a contactor auxiliary contact, matches the requested state | Whether the site load changed by the expected amount |
| Outcome measured | An independent meter shows the intended physical result | Whether the result holds after the observation window |
MQTT shows where the second stage ends. When a client publishes at QoS 1, the broker is the receiving endpoint. In MQTT 5, a PUBACK carries a reason code, which can be success or an error, so check it before you record acceptance. The specification lets the receiver send PUBACK before it completes onward delivery. A successful PUBACK therefore tells you nothing about the subscriber, the PLC or the contactor. QoS 1 is also at-least-once delivery, so a subscriber can receive the same command twice. Give each command an ID, and make the controller ignore a repeat. The MQTT over TLS guide covers broker identity and topic access at this boundary.
Here is one load-shed event. The site imports 1,180 kW, and the aggregator asks for a 250 kW reduction. The site PLC opens the contactor on a chiller. A ZEM-65 on the main incomer, Class 0.5S to IEC 62053-22 and separate from the PLC, measures the outcome.
| Time | Event | Stage |
|---|---|---|
| 14:02:00.000 | SCADA logs command DR-0412, shed 250 kW, from the aggregator's dispatch | Request authorised |
| 14:02:00.180 | The broker returns PUBACK with reason code 0x00 (Success) | Endpoint accepted |
| 14:02:00.950 | The PLC acknowledges DR-0412 and opens the chiller contactor | Controller processed |
| 14:02:01.300 | The contactor auxiliary contact reads open | State verified |
| 14:03:00 | The incomer reads 935 kW, 245 kW below the pre-event baseline | Outcome measured |
The project sets a deadline for each stage. In this example, the PLC must acknowledge within 5 s, the contactor feedback must change within 10 s, and the meter must show at least 80% of the requested reduction within 60 s. A missed deadline raises an alarm and names the stage that failed. If the contactor opens but the incomer falls by only 40 kW, the chiller was probably at part load. Report the measured 40 kW. Other loads also move during the event, so compare the meter against a baseline for the same period, not against one reading. Set the timeouts, retry limits and the response to a missed stage for each command class in the project specification. Protocol defaults do not supply them.
Common SCADA failures
Most of these faults produce believable numbers, so each one needs a deliberate test: Run fault injection, link interruptions and command tests only in a controlled test setup or under a site-approved procedure with a qualified operator, independent protection and an agreed recovery plan. Do not disable live protection or feedback as an improvised test.
| Failure | How to find it |
|---|---|
| The last value stays on screen after the source stops | A source heartbeat or acquisition timestamp stops advancing beyond its documented interval |
| Arrival time replaces measurement time after a replay | A false peak follows every outage. Compare source and ingestion timestamps. |
| Replay creates duplicate samples | More samples per point per interval than the expected rate allows |
| Watts labelled as kilowatts, or power labelled as energy | Compare with the device's own display at a steady load |
| Registers decoded in the wrong word order | A value near zero or far too large. Decode a known reading in each order. |
| Two systems write the same setpoint | The setpoint changes with no logged command from its owner. For BACnet, read Priority_Array. |
A PUBACK is shown as "command complete" | The command log has no state-feedback stage |
| A command path depends on the WAN and bypasses local interlocks | Disconnect the WAN during a test command and watch the local controller |
| Alarm shelving and configuration changes leave no audit record | Shelve one alarm during commissioning and find it in the audit log |
To find the hop that is wrong, compare one point at the same timestamp in four places: the device's display or local tool, the gateway, the SCADA screen and the historian.
Security
NIST recommends that you identify and segment IT and OT devices, map the data flows that operation needs, and permit only those flows between segments. It also recommends authenticated, encrypted communications between distributed sites (NIST SP 800-82 Rev. 3).
Each protocol handles this differently. Plain Modbus/TCP on port 502 has no authentication, so keep it inside a segmented network, or use MODBUS/TCP Security on port 802 where both ends support it. OPC UA offers three message security modes: None, Sign, and SignAndEncrypt (OPC UA Part 4, 7.20). Edge's OPC UA client defaults to None. Set it to SignAndEncrypt with a current policy such as Basic256Sha256, and match the endpoint that the server advertises. For MQTT, use TLS, verify the broker certificate, and limit each client to its own topics. The MQTT over TLS guide gives the procedure.
Commissioning checklist
Set the pass limits in the project specification. The values below are typical starting points.
- Match each physical asset to its device address, register or object, SCADA tag and historian series. Check each one on site.
- At a steady load, read the device's own display or local tool. Compare the value at the gateway, on the SCADA screen and in the historian. After unit conversion, every hop must agree to the displayed resolution.
- Compare source and ingestion timestamps. Clocks must agree within the project tolerance, for example 1 s. Stop one source, and confirm that SCADA marks it stale within three expected intervals.
- Disconnect the field link and the WAN separately. Record what the local controller does, when each alarm appears and what the gateway buffers.
- Restore the WAN after a 30-minute outage. For a point with a 60 s interval, the historian must hold 30 backfilled samples with their original timestamps, no duplicates and no gap. No interval across the outage may show negative or doubled energy.
- Send one safe, authorised test command for each command class. Record all five evidence stages. Then block one stage, for example the feedback input, and confirm that the timeout alarm names that stage.
- Connect with an untrusted certificate and with wrong credentials. Confirm that both attempts are refused and logged. Confirm that only the planned flows cross each segment boundary.
- Restart each component in turn. Confirm configuration, subscriptions and data continuity. After an Edge restart, confirm that each Modbus server register holds a fresh value again.
- Keep the evidence: test inputs, timestamps, expected and observed results, firmware and configuration versions, and any accepted exceptions.